
Figure 3.
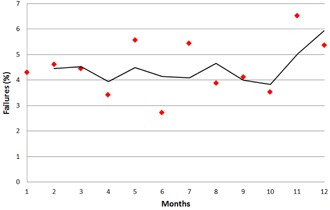
A plot of the percentage of failures per month, along with a fitted moving average trend line.
Official websites use .gov
A
.gov website belongs to an official
government organization in the United States.
Secure .gov websites use HTTPS
A lock (
) or https:// means you've safely
connected to the .gov website. Share sensitive
information only on official, secure websites.
A plot of the percentage of failures per month, along with a fitted moving average trend line.