
Figure 6.
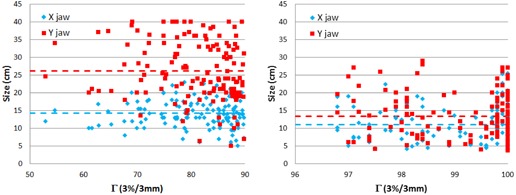
The × and Y jaw size plotted against the gamma passing rate, Γ, () separately for the failed QAs (left) and the passing QAs (right).
Official websites use .gov
A
.gov website belongs to an official
government organization in the United States.
Secure .gov websites use HTTPS
A lock (
) or https:// means you've safely
connected to the .gov website. Share sensitive
information only on official, secure websites.
The × and Y jaw size plotted against the gamma passing rate, Γ, () separately for the failed QAs (left) and the passing QAs (right).