
Figure 3.
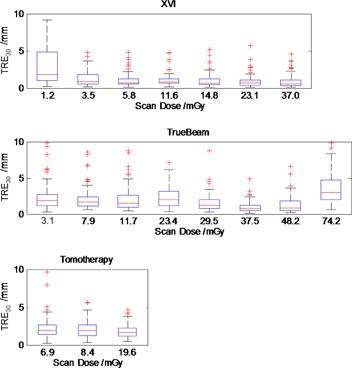
Residual for , , and TomoTherapy. Boxplots in order of increasing dose from left to right within each plot. Each boxplot represents 100 image registrations. Failures of the automatic registration were considered when was larger than 3.6 mm. This occurred in 5%–10% of matches over the central clinical dose range. Large errors were observed for low dose on XVI and high dose on TB.