
Figure 10.
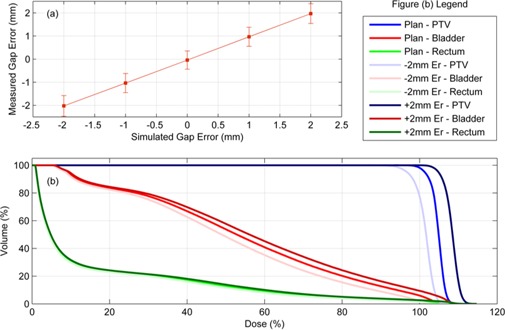
A plot (a) of the measured mean leaf gap error for each leaf gap error that was introduced (0 mm, ). The dose was reconstructed for each case and the DVH is plotted in (b) for the planned dose and leaf gap error deliveries.
Official websites use .gov
A
.gov website belongs to an official
government organization in the United States.
Secure .gov websites use HTTPS
A lock (
) or https:// means you've safely
connected to the .gov website. Share sensitive
information only on official, secure websites.
A plot (a) of the measured mean leaf gap error for each leaf gap error that was introduced (0 mm, ). The dose was reconstructed for each case and the DVH is plotted in (b) for the planned dose and leaf gap error deliveries.