
Figure 5.
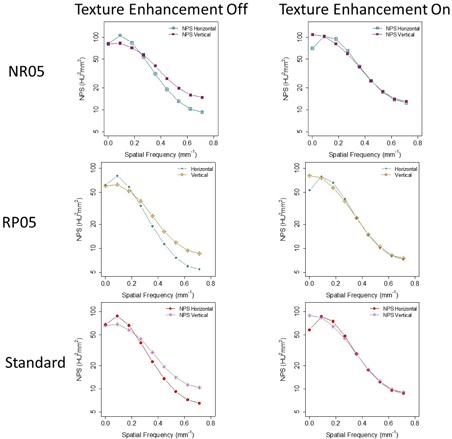
Comparison between images reconstructed with (left column) and without (right column) Texture Enhancement for levels of 5.81 mGy. NPS analyses indicated that and were better matched when Texture Enhancement was applied, indicating more isotropic noise behavior. Target Thickness was set to 0.625 mm for the maximum noise reduction. The images were first reconstructed into 0.625 mm images and they were then reformatted into 2.5 mm images for NPS analysis.