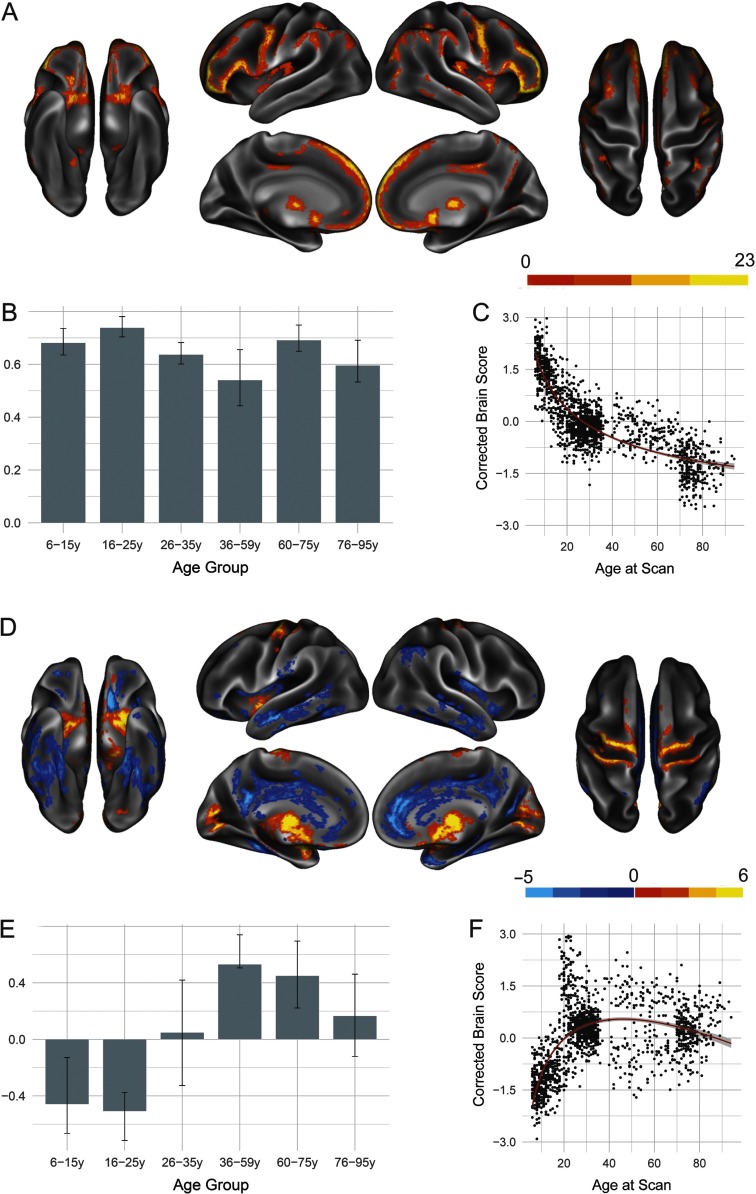
Figure 4. .
Structural covariance of the frontoparietal control network. (A) The spatial pattern for the first latent variable, thresholded at 95% of the bootstrap ratio. (B) The bootstrapped correlation of brain scores with averaged gray matter volume estimates of frontoparietal control network seeds. (C) The individual brain scores from the first latent variable corrected for scanner strength and gender are plotted as a function of age. (D) Spatial pattern for the second latent variable, thresholded at 95% of the bootstrap ratio. (E) The bootstrapped correlation of brain scores with averaged gray matter volume estimates of default network seeds by age group for the second latent variable. (F) The individual brain scores from the second latent variable corrected for scanner strength and gender are plotted as a function of age.

