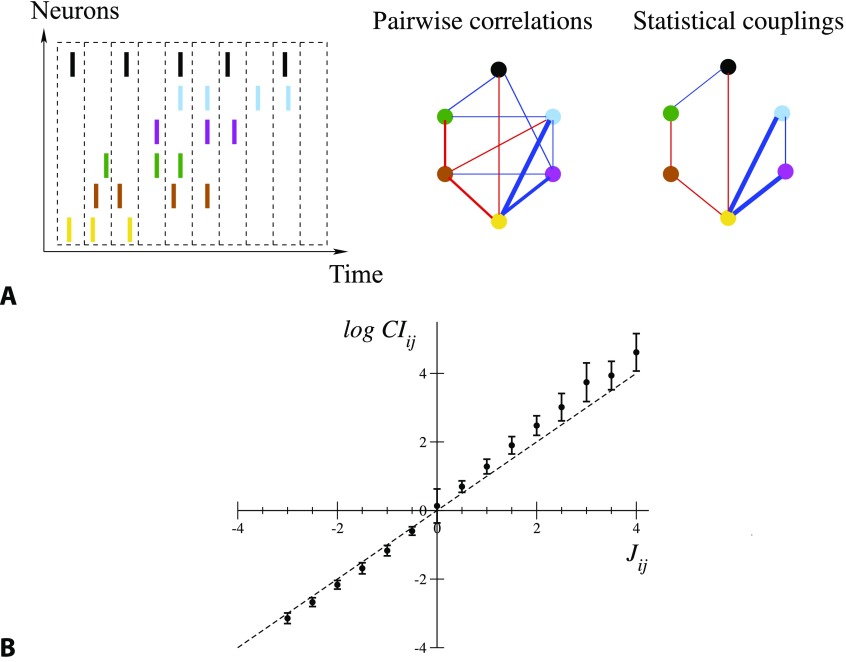
Figure 1. .
From spiking data to the Ising model. (A) Spiking times are binned into time bins of width Δt; each neuron i is assigned the variable σi = 1 or 0, depending on whether it is active in the time bin (left). Pairwise correlation indices CIij are computed from this binned data, and define a network of correlations (middle). The network of statistical couplings Jij defining the Ising model distribution P, Equation 1, is generally sparser (right). Red and blue links correspond, respectively, to CI > 1, J > 0 and to CI < 1, J < 0; the widths are proportional to the absolute values. Links corresponding to CI or J smaller than one tenth of the maximal correlation index or coupling are not shown. (B) Average values and standard deviations of log CIij over intervals of couplings 0.5 n − 0.25 ≤ Jij < 0.5 n + 0.25, with integer n, for all epochs and sessions. Note the large error bar in J = 0, corresponding to the very large number of pairs i, j carrying vanishing couplings; see Figure 1A.

