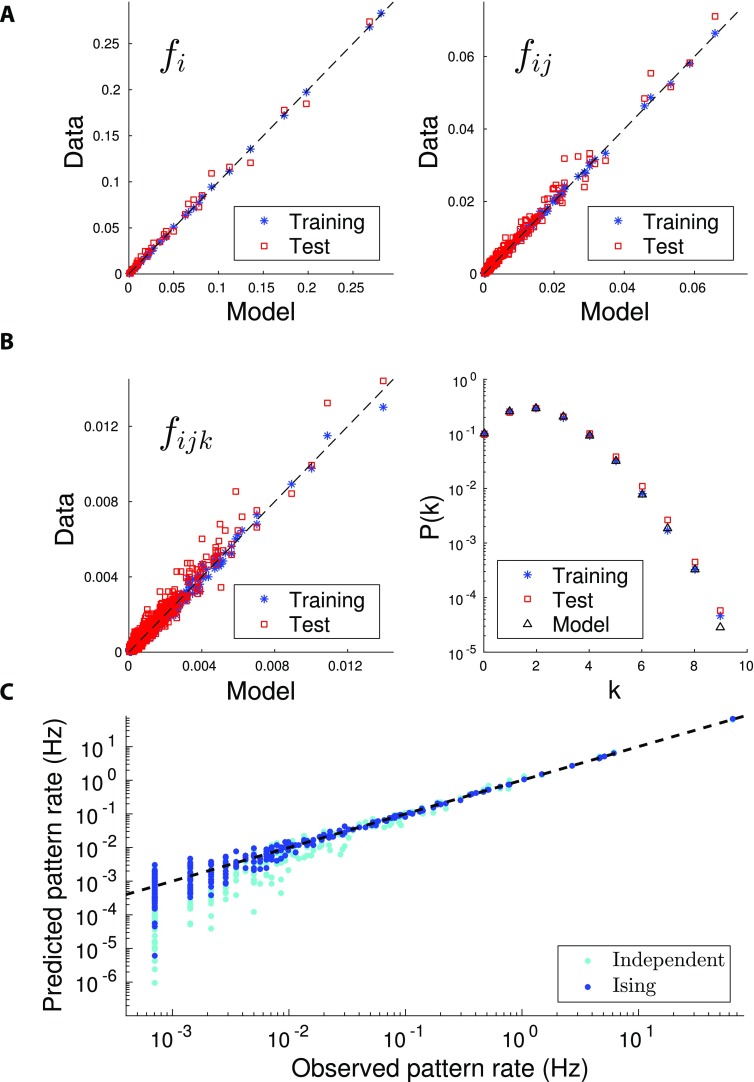
Figure 2. .
Quality and validation of the inferred model. Reproduction of the statistics of the spiking data for the Task epoch of session A. All panels compare the values of the observables computed from the spiking data with their counterparts computed from the inferred model distribution P, Equation 1. (A) Firing probabilities of single (fi, left panel) and pairs of (fij, right panel) neurons. The agreement between the spiking probabilities computed from the data and from the inferred Ising distribution shows that the inference procedure is accurate. Model distribution P was inferred from three fourths of the recorded data and tested on the same data (blue cross) and on the remaining one fourth of the recording (cross-validation, red squares). (B) Probabilities of firing for triplets (fijk, left panel) of neurons, and of k neurons to be simultaneously active in a time bin of duration Δt = 10 ms (right panel). The agreement between the data and model multiple-neuron firing probabilities (p(k)) is very good as long as p(k) times the number of time bins in the recording is > 1, that is, provided the recording time is sufficient to sample rare configurations of multiple neuron firing. Same cross-validation procedure and symbols as in Figure 2A. (C) Probabilities of the 210 = 1,024 activity configurations over a subset of 10 cells in the Task epoch of session A. Blue symbols show the scatter plot for the Ising distribution P (inferred from all recorded data), while cyan symbols correspond to the independent-cell model (with all couplings Jij = 0, and local inputs hi fitted to reproduce the single-neuron probabilities fi). Similar plots are found for other subsets of 10 cells among the N = 37 recorded cells.

