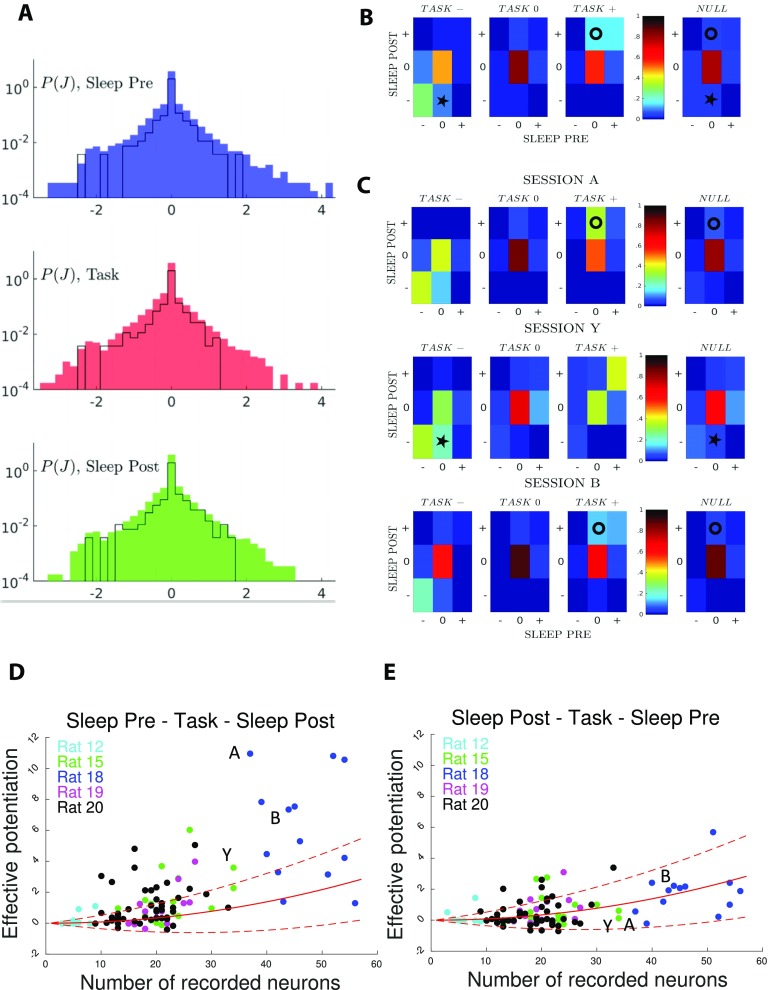
Figure 3. .
Comparison of couplings across epochs shows task-related effective potentiation. (A) Distributions of the inferred couplings J across the recording sessions for the three epochs (from top to down, Sleep Pre, task, and Sleep Post). The black lines show the histograms for session A only. The sharp peaks in J = 0 in the coupling distributions show that the inferred coupling networks are sparse. The average fractions of vanishing couplings are close to 0.75 in all three epochs. The part of the J distributions corresponding to the minimal value of couplings (≃−2) permitted by the regularization is due to pairs of cells that never spike together (fij = 0); see Methods. (B) Fractions of pairs of neurons (i, j) in the 27 classes [xyz], where x, y, and z = −,0,+ are the signs of the inferred couplings Jij in, respectively, Sleep Pre, Task, and Sleep Post. Fractions are computed from all epochs in the 96 recorded sessions. Rightmost column: null model for the fractions corresponding to classes x, z in the Sleep epochs, irrespective of the y class in Task. Circle and star symbols identify classes referred to in main text. (C) Same as panel B, but for sessions A (top), Y (middle), and B (bottom). (D) Effective potentiation Pot (Equation 3) is shown for the 96 experimental sessions as a function of the number of recorded neurons identified in all three epochs. Colors identify the five recorded rats. Sessions A, B, Y are shown with their labels. Red lines show the effective potentiation (average: full line, ± 1 standard deviation: dashed lines) expected from the null model as a function of the number of recorded neural cells; see Methods. (E) Right: control case, where we have exchanged the Sleep Pre and Sleep Post inferred couplings.

