Figure 5. .
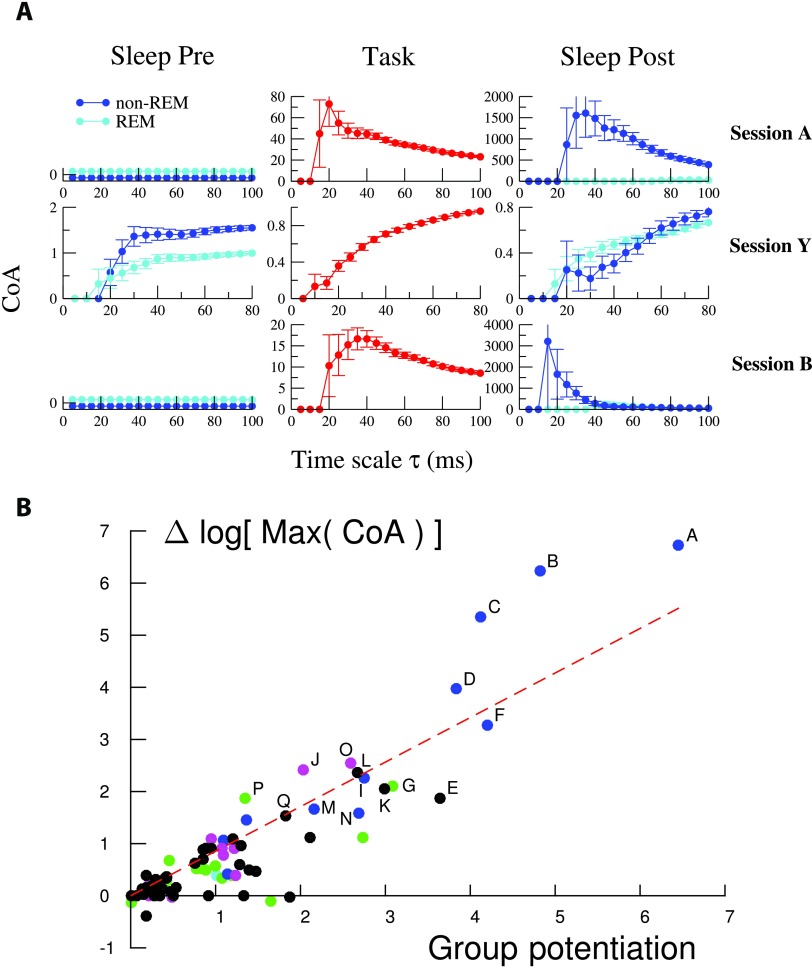
Neurons supporting effectively potentiated couplings show strong increase in coactivation. (A) Assembly coactivation ratio (CoA) for groups supporting the effectively potentiated networks of sessions A, Y, and B. Light and dark blue curves show the CoA for, respectively, the REM and non-REM periods of the Sleep epochs. CoAs are shown for time scales τ ranging from 5 ms to n × 20 ms, where n is the number of neurons in each group considered. Note the variations in the CoA and temporal scales along the y- and x-axis between the panels. See Methods for the computation of error bars. Note that values of CoA smaller or equal to unity can be compatible with the independent-cell hypothesis when neurons have very low firing rates; see Methods. The potentiated groups of sessions A, B, and Y include, respectively, five, five, and four neurons. (B) Logarithmic change in the peak CoA of the identified potentiated group between Sleep Pre and Sleep Post vs. potentiation Pot for all experimental sessions with at least two cells in the potentiated group. The sessions labeled A–Q have a large group potentiation and a large logarithmic change in their peak CoA (Δ log Max (CoA) > 1.5). The straight line shows a linear fit of the results (slope = 0.85, R2 = 0.8, p value = 10−32), proving that large Pot correspond to strong differences in coactivation in the spiking data between the Sleep Pre and the Sleep Post epochs.

