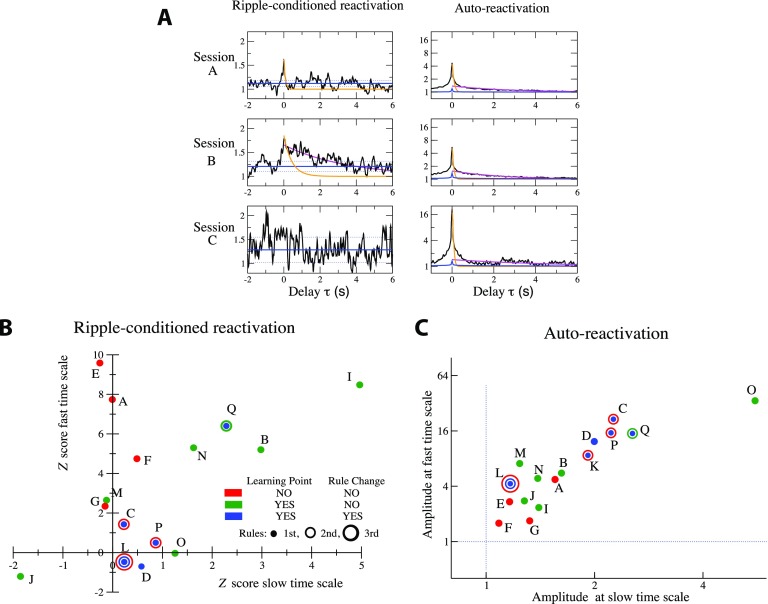
Figure 6. .
Ripple-reactivation and auto-reactivation of potentiated groups and learning behaviors. (A) Sliding average over a 50 ms time window of the ripple-conditioned reactivation (RR(τ) in Equation 5, left panels) and auto-reactivation (AR(τ) in Equation 6, right panels) of the potentiated groups for sessions A, B, and C. Orange and magenta lines show, respectively, exponential fits of the fast (over the 20 < τ < 100 ms range) and slow (over the 1 < τ < 4 s range) components to RR and AR. Fast decay times are so fitted to τ = 85 ms and τ = 400 ms for, respectively, sessions A and B, and the slow decay time for session B is τ = 3.5 s. Left: blue lines represent the null model for RR (full line: average value of RR, dotted lines: ± 1 standard deviation); see Methods. Right: blue lines show for comparison the AR curve of the groups of the same size as the potentiated groups and containing the most active neurons in each session. (B) Z scores Z(τ), Equation 11 in Methods, of the amplitude of the fast (τ = 0) and the slow (averaged over 0.5 s < τ < 1.5 s) components to the ripple-conditioned reactivation for sessions A to Q. Each session is represented by one, two, or three circles of increasing diameters, depending on the number of rules. For each rule the color of the corresponding circle indicates whether the learning-point and rule-changing criteria were reached. Session K is not shown because of the very small number of detected ripples. In session D, both learning-point and rule-changing criteria were met but the rule was not changed in the experiment as it should have been; see SI, Section IX (Tavoni et al., 2017). Average and standard deviation of the fast decay times over the eight sessions with largest fast responses to ripples are τRR−fast = 230 ± 180 ms. Average value and standard deviation of the slow decay time over the three sessions (I, B, Q) with a significant slow response to ripples are τRR−slow = 4 ± 3 s. (C) Amplitudes of the fast (in τ = 0) and the slow (average over 0.5 s < τ < 1.5 s) components in AR(τ) for sessions A to Q. Same color code for learning behavior as in panel B. Fast and slow decay time constants, fitted over all sessions are, respectively, τAR−fast = 56 ± 24 ms and τAR−slow = 3 ± 1.5 s.

