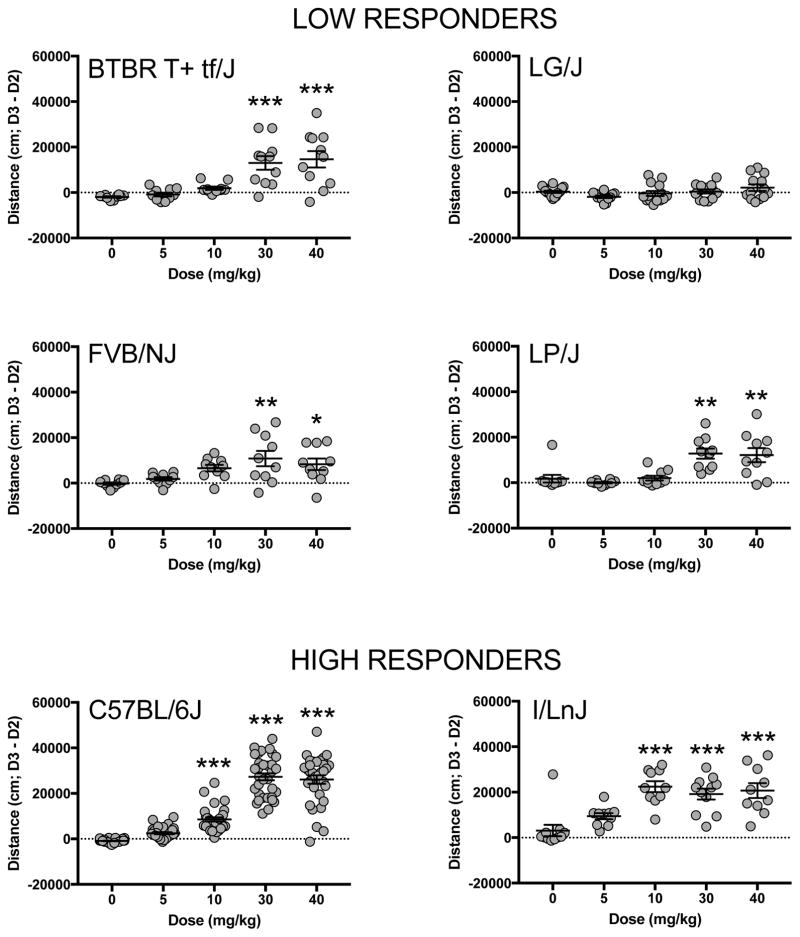
Figure 1. Dose response of cocaine locomotor activation in high and low responding inbred mouse strains.
Locomotor response to cocaine displayed as the difference between locomotor activity on Day 3 minus Day 2. Each data point represents an individual animal and error bars are standard error of the mean. Asterisks denote significant difference from saline control. *p<0.05, **p<0.01, ***p<0.001.

