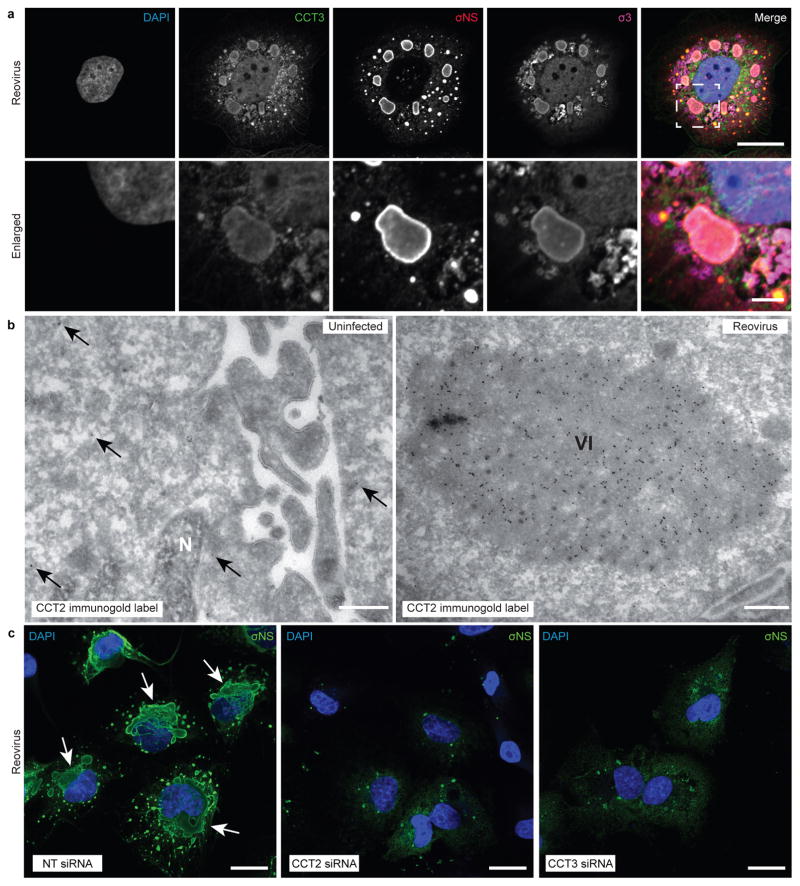
Figure 3. TRiC redistributes to viral inclusions and is required for inclusion morphogenesis.
a, Confocal immunofluorescence images of T3D reovirus-infected HBMECs (MOI of 100 PFU/cell, 24 h post-infection) stained with DAPI (blue), and antibodies specific for CCT3 (green), σNS (red), and σ3 (magenta). Viral inclusions are identifiable by σNS staining. Enlarged images correspond to the region indicated by the white dashed box in the merged image. Scale bars, 20 μm and 4 μm in full-sized and enlarged images, respectively. b, Tokuyasu cryosections of uninfected or T1L reovirus-infected (MOI of 1 PFU/cell, 20 h post-infection) HBMECs immunogold labeled for CCT2. Scale bars, 500 nm. Arrows indicate gold particles observed in uninfected cells. VI, viral inclusion; N, nucleus. c, Confocal immunofluorescence images of HBMECs transfected with NT or TRiC subunit-specific siRNAs, infected with T1L reovirus (MOI of 100 PFU/cell, 24 h post-infection), and stained with DAPI (blue) and a σNS-specific antiserum (green). Scale bars: 20 μm. Large, globular inclusions are marked by white arrows. Images are representative of three independent experiments conducted with similar results.

