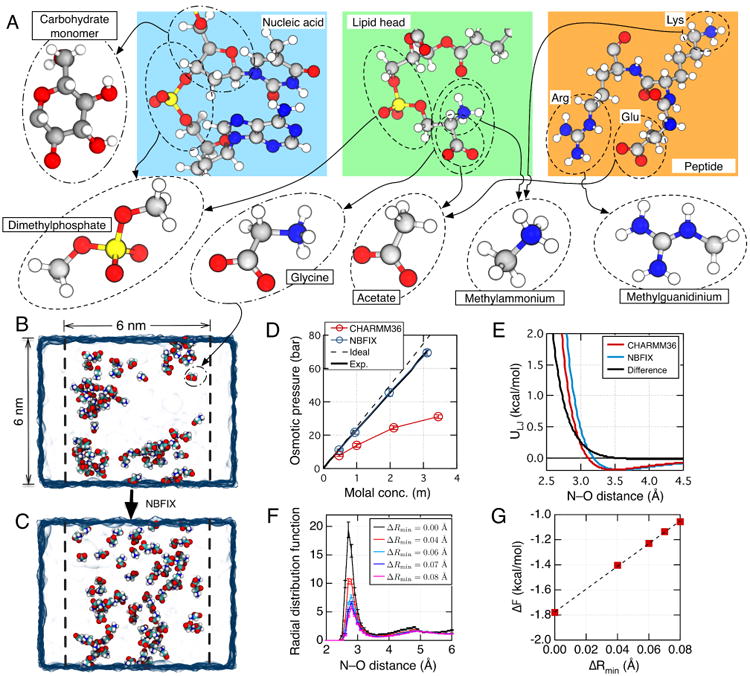
Fig. 2.

NBFIX calibration using model compounds. (A) To perform NBFIX calibration, complex biological molecules are represented by simpler model compounds. The compounds are chosen to isolate a specific type of inter-solute interactions, which can be modulated by the NBFIX correction. The figure shows a possible decomposition of three representative biomolecules—a nucleic acid fragment, a lipid molecule and a peptide. Molecular structures are shown using the ball-and-stick representation where each atom is colored according to its type: hydrogen, white; carbon, gray; nitrogen, blue; oxygen, red; phosphorus, yellow. (B,C) Calibration of amine–carboxylate interactions using the osmotic pressure of a glycine solution. The simulated system includes a volume of water (blue semi-transparent surface) divided into two compartments by two planar half-harmonic potentials (depicted by dashed lines). Glycine monomers (shown as spheres colored by atom: carbon, cyan; hydrogen, white; oxygen, red; nitrogen, blue) are confined to remain within one compartment by the half-harmonic potentials while water can exchange between the compartments freely. The difference in the glycine concentration between the two compartments generates osmotic pressure. The equilibrium osmotic pressure value is determined from the average force exerted by the confining potentials on the glycine molecules and the cross-section area of the system. Panels B and C illustrate instantaneous configurations of a 3 m glycine solution observed at the end of two 25 ns simulations performed using the standard CHARMM36 force field without (B) and with (C) the NBFIX correction. (D) Osmotic pressure of a glycine solution as a function of its concentration obtained from MD simulations performed using the CHARMM force field with (blue) and without (red) the NBFIX corrections. Experimentally determined72 and ideal solution (osmotic coefficient = 1) dependences are shown as solid and dashed black lines, respectively. (E) The effect of an NBFIX correction (ΔRmin = 0.08 Å) on the LJ interaction potential between amine nitrogen and carboxylate oxygen. The LJ potentials are plotted using the standard CHARMM force field with (blue) and without (red) the NBFIX correction. The difference between the NBFIX and standard potentials is shown as a black line. (F) Inter-molecular radial distribution function (RDF) of glycine nitrogen with respect to glycine oxygen in MD simulations of a ∼3 m glycine solution at several values of ΔRmin. Error bars indicate standard error. The value of ΔRmin affects the height of the first peak, g1. (G) Correlation between ΔRmin and ΔF = −kBTlog(g1). Dashed line indicates a linear fit. Figures in panels B–D were adapted with permission from Ref. 41.
