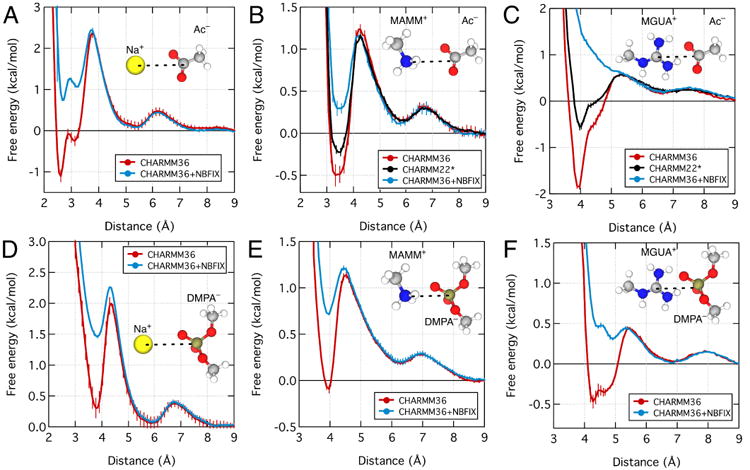
Fig. 4.

Effect of NBFIX corrections on the PMF between sodium and acetate (A), methylammonium and acetate (B), methylguanidinium and acetate (C), sodium and dimethylphosphate (D), methylammonium and dimethylphosphate (E), and methylguanidinium and dimethylphosphate (F). The reaction coordinate was defined as the distance between the following atoms of the ion pairs: sodium, nitrogen of methylammonium, nitrogen of methylguanidinium, carboxylate carbon of acetate, and phosphorus of dimethylphosphate. Each panel shows the PMFs computed using the standard CHARMM3666 (red) and the CHARMM36 force field with the NBFIX correction41 (blue). In panels B and C, the black lines show the PMFs computed using CHARMM22*30. The inset of each plot shows the chemical structure of the ion pair. Except for panel C, all NBFIX-corrected data were obtained using parameters developed in Ref. 41. Fig. 5 and Section 3.1.2 describe the development of the NBFIX correction for the guanidinium–carboxylate pair.
