Fig. 1.
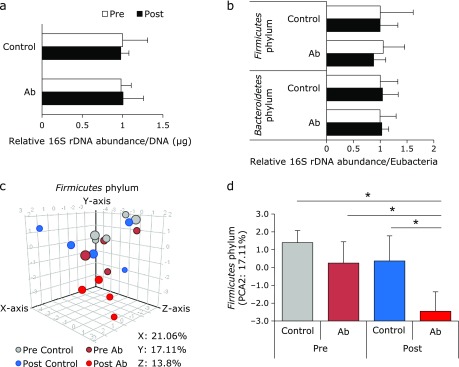
Fecal microbiota of the mother mice. (a) The relative amounts of mothers’ total fecal bacteria before antibiotic administration (pre), and after antibiotic administration (post) were analyzed by RT-PCR for Eubacteria (as total bacteria) and the phyla Bacteroidetes and Firmicutes. Total bacteria were corrected for fecal DNA concentration. Bacteroidetes and Firmicutes were corrected for the amounts of total bacteria. (c) Three-dimensional of PCA plot of DGGE band pattern in Firmicutes phylum. (d) Scale of Y axis in PCA of Firmicutes phylum. Control group (n = 5), Antibiotics group (Ab, n = 4). Data are shown as average and SD. *p<0.05.

