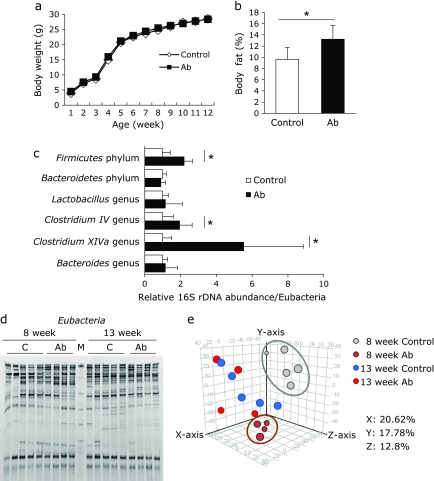
Fig. 2.
Fecal microbiota and body composition in mouse pups. (a) Changes in body weight of pups from weeks 1 to 12. (b) Percentage of abdominal body fat at 12 weeks. (c) The relative amounts of pups’ fecal bacteria at 8 weeks was analyzed by RT-PCR. The number of all bacteria was corrected by the amount of Eubacteria. (d) Band image of DGGE analysis of DNA from feces at 8 and 13 weeks. (e) PCA plots of each DGGE band pattern in total bacteria. M, DNA marker; Control group (n = 5); Antibiotics group (Ab, n = 4). Data are shown as average and SD. *p<0.05.

