
FIGURE 2.
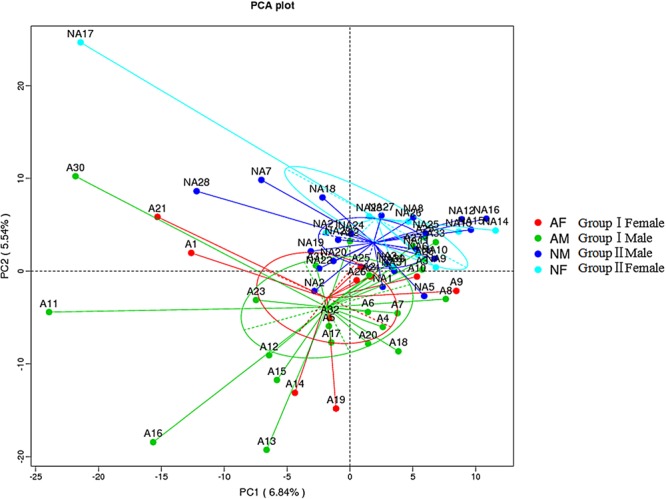
Beta diversity assessment of gut microbiome. Principles Component Analysis (PCA) was used and a scatterplot was generated to determine the phylogenetic distances between bacterial communities. The axes indicate the percentages of variation in the data for the bacterial communities. Dot symbols in different representing color that cluster together are circled in red, green, dark blue, and light blue, respectively.