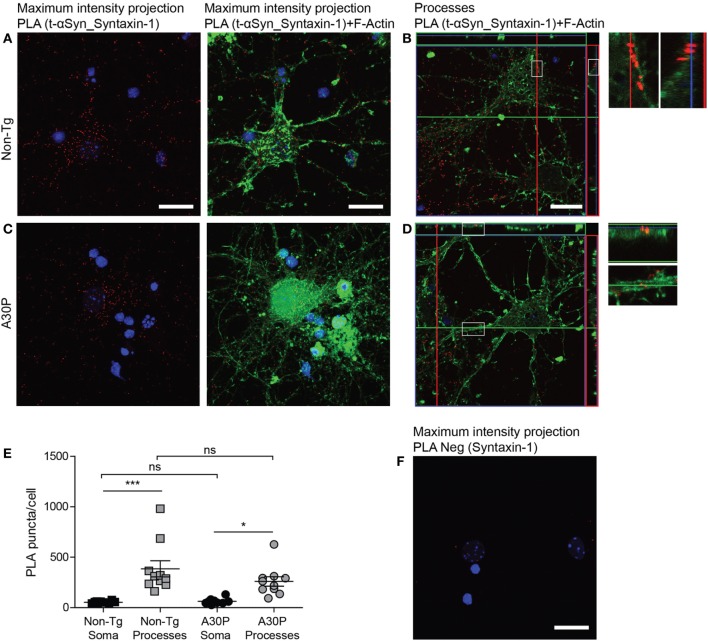
Figure 5.
Representative confocal images of in situ proximity ligation assay (PLA) between alpha-synuclein (αSyn) (mAb1338) and syntaxin-1 (red) in non-tg (A,B) and A30P (C,D) cortical primary neurons. Maximum intensity projections of a confocal z-stack including a whole cell were performed to observe the maximum amount of PLA puncta (A,C). Cross section of the processes allows visualization of the PLA puncta in an orthogonal view (B,D, inlet), scale bar 20 µm. F-actin stained by phalloidin-FITC (green) and DAPI (blue). Quantification of amount of PLA puncta per cell in the soma and processes. One-way ANOVA followed by Bonferroni post hoc test, non-significant (ns), ***P < 0.001. Error bars represent the SEM (E) Negative control PLA with syntaxin-1 antibody only (F). Scale bar 50 µm.

