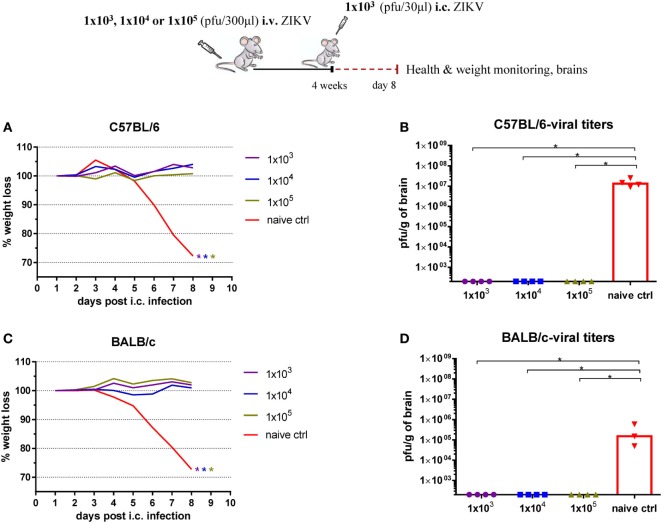
Figure 2.
Determination of a suitable dose for i.v. immunization. Wild-type C57BL/6 (A,B) and BALB/c (C,D) mice were inoculated with 1 × 10³, 1 × 10⁴, or 1 × 10⁵ pfu Zika virus (ZIKV) i.v., and 4 weeks later, these mice and naïve controls were challenged with 1 × 10³ pfu ZIKV i.c. Mice were weighed daily (A,C), and on day 7 post i.c. challenge, brains were removed and viral titers were measured by a plaque assay (B,D). The detection limit for virus in the brain was 250 pfu/g organ. Each dot represents an individual animal and bars the medians of the groups. The weight curves (A,C) depict the group medians. n = 3–4 mice/group, *p < 0.05. For the weight curves, the color of the star denotes the infected group, which forms the basis for statistical comparison with naïve mice.

