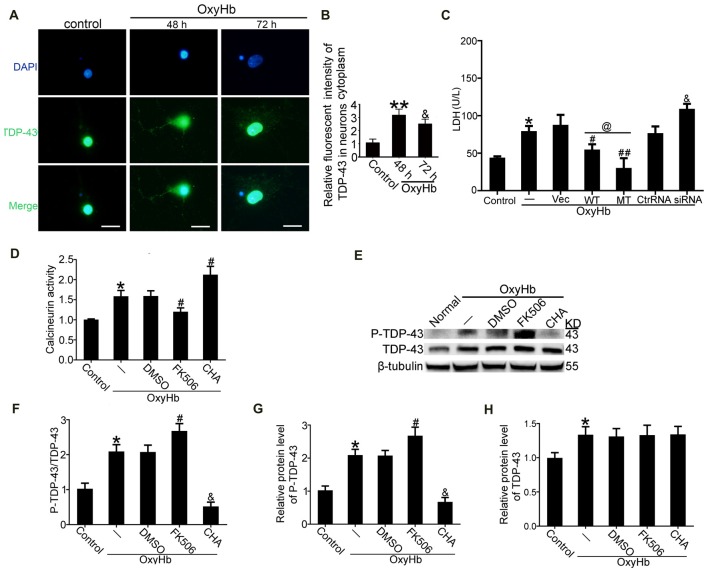
Figure 6.
TDP-43 mutation reduced neuronal injury, and CN dephosphorylated TDP-43 after OxyHb treatment. (A,B) Immunofluorescence staining to assess changes in TDP-43 expression at 48 h in vitro. All values are mean ± SEM, **p < 0.01 48 h vs. sham, &p < 0.05 48 h vs. 72 h, scale bar: 50 μm. All the experiments above were performed three times. (C) LDH release in serum was measured using an LDH kit. Data are presented as mean ± SEM (**p < 0.05 vs. control; #p < 0.05, ##p < 0.05 vs. OxyHb + vehicle; @p < 0.05 OxyHb + wild type (WT) vs. OxyHb + MT; &p < 0.05 OxyHb + siRNA vs. OxyHb + control RNA). (D) Activity of CN after CHA and FK506 treatment was measured. Data are presented as mean ± SEM (*p < 0.05 vs. control; #p < 0.05 OxyHb + DMSO vs. OxyHb + FK506 and OxyHb + CHA). (E) Western blot analysis of TDP-43 and P-TDP-43 protein levels after CHA and FK506 treatments. (F) P-TDP-43 protein levels were normalized to that of TDP-43. (G) P-TDP-43 protein levels were normalized to that of β-tubulin. (H) TDP-43 protein levels were normalized to that of β-tubulin. Data are presented as mean ± SEM (*p < 0.05 vs. control; #p < 0.05 OxyHb + DMSO vs. OxyHb + FK506; &p < 0.05 OxyHb + CHA vs. OxyHb + FK506).

