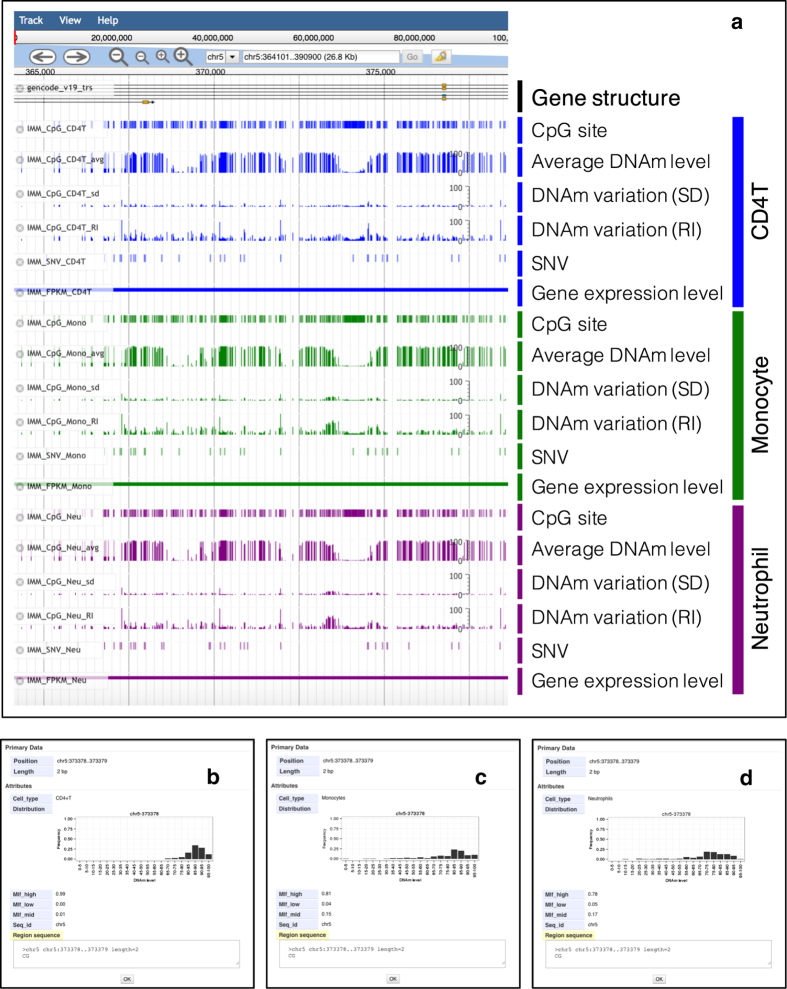
Figure 1.
Graphical view of iMETHYL. (a) Three-layer omics data are provided as browser tracks. The browser displays several tracks, which are shown for the region surrounding the DNAm biomarker for tobacco smoking, cg05575921. Users can select tracks that provide information from external sources on gene structure, expression, and SNVs and cell-type-specific original tracks (e.g., CD4T, monocytes, and neutrophils) that show average DNAm levels and different measures of variation (SD and RI). (b–d) Detailed information on CpG tracks for CD4T, monocytes, and neutrophils. The frequencies of the three DNAm categories among individuals are shown as Mlf_high (≥ 67%), Mlf_mid (34–66%), and Mlf_low (≤ 33%). CD4T, CD4+ T-lymphocytes; DNAm, DNA methylation; Mlf_high, frequency of hypermethylated DNA; Mlf_high, frequency of hypermethylated DNA; Mlf_low, frequency of hypomethylated DNA; Mlf_mid, frequency of intermediate methylation DNA; RI, reference interval; SD, standard deviation; SNV, single-nucleotide variation.

