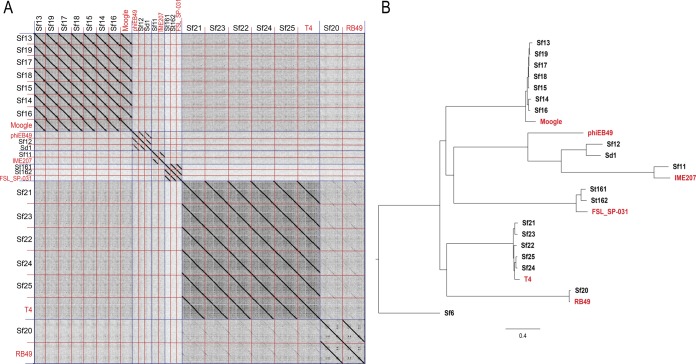
FIG 2.
Genomic and phylogenetic analysis of environmental isolates. (A) Dot plot of all phage genomes compared with each other, including reference genomes of related phages shown in red. Species are separated by blue (long) lines, with individual isolates separated by red (short) lines. (B) Bayesian inference phylogenetic tree of environmental isolates. The scale bar represents 0.4 nucleotide substitutions per site.

