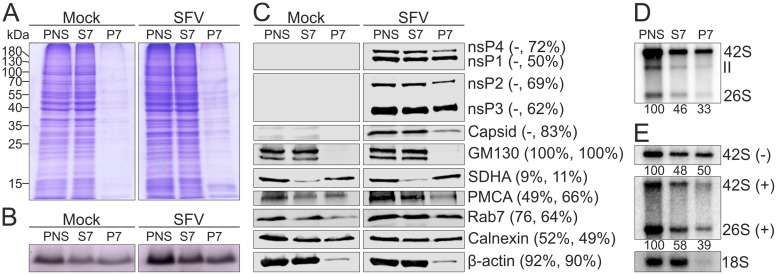
FIG 4.
Distribution of proteins, lipids, and RNA in the S7 and P7 fractions. PNS was prepared from mock- or SFV-infected (MOI of 500) BHK cells treated with wortmannin and separated into an S7 supernatant and P7 pellet. (A and B) Protein and lipid profiles of PNS, S7, and P7 in an SDS-polyacrylamide gel stained with Coomassie blue (A) or Sudan black B (B). Numbers on the left indicate the molecular masses (kDa) of marker proteins. (C) Distribution of viral and cellular markers as studied by Western blotting. PMCA was used as a marker for the plasma membrane, GM130 for the Golgi membrane, calnexin for the endoplasmic reticulum, SDHA for the mitochondria, Rab7 for the late endosomes, and β-actin for the cytosol. Numbers in parentheses indicate the percentage of the protein present in the S7 fraction compared to that in PNS. The first number is from mock-infected samples and the second one from virus-infected samples. (D) Incorporation of [32P]CTP into SFV RNA in PNS, S7, and P7 prepared from SFV-infected cells. Numbers below the lanes indicate the amount of incorporation into 42S RNA as a percentage of the label incorporated in PNS. (E) Distribution of endogenous minus- and plus-strand RNA analyzed by in-gel hybridization from PNS, S7, and P7 prepared from SFV-infected cells. As a control, a probe against 18S rRNA was used. Numbers below the lanes indicate the amount of 42S RNA as a percentage of that in PNS.

