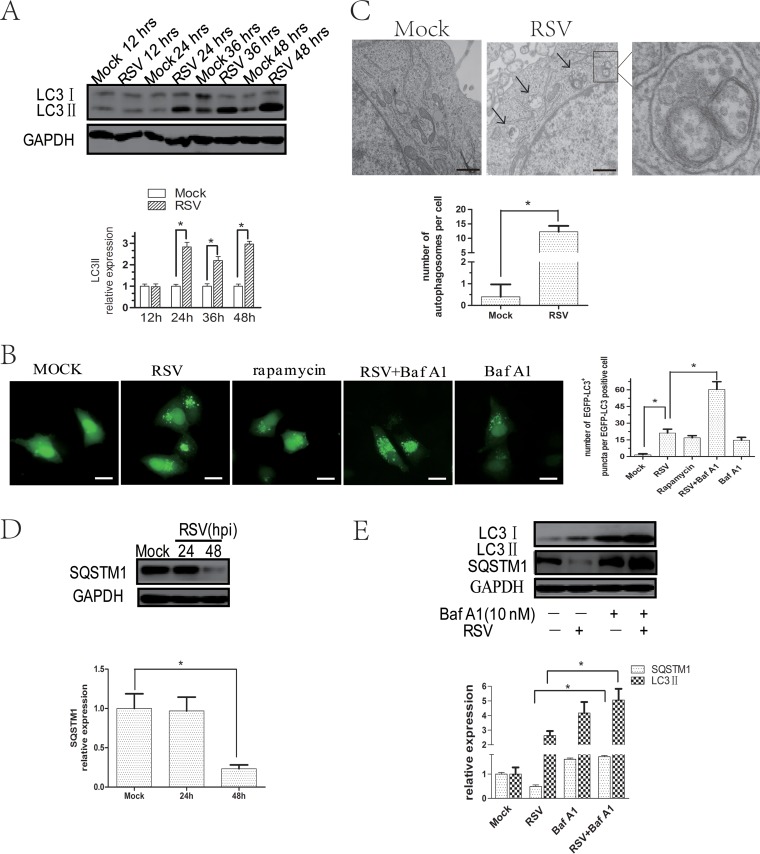
FIG 2.
RSV infection induces complete autophagy flux in HEp-2 cells. (A) HEp-2 cells were mock infected or infected with RSV (MOI = 5) for indicated times. The expression of LC3IIand GAPDH was analyzed with their specific antibodies as described in Materials and Methods. (B) HEp-2 cells transfected with pBABE-puro-EGFP-LC3 plasmid for 24 h were mock infected or infected with RSV in the absence or presence of Baf A1 for 24 h and analyzed by fluorescence microscopy for the presence of fluorescent EGFP-LC3 puncta. Bar, 20 μm. Rapamycin was used as a positive control. The bar graph represents the number of puncta per EGFP-LC3-positive cell. The data are from 50 cells per sample. (C) HEp-2 cells were infected with RSV (MOI = 5) for 24 h and examined by transmission electron microscope. The black arrows depict double-membraned autophagosomes. The bar graph represents the number of autophagosomes per cell. The data are from 50 cells per sample. Bar, 333 nm. (D) HEp-2 cells were mock infected or infected with RSV (MOI = 5) for 24 and 48 h and then analyzed by immunoblotting with anti-SQSTM1 and anti-GAPDH antibodies. (E) Cells were infected with RSV (MOI = 5) for 48 h in the presence or absence of Baf A1 (10 nM). Cell lysates were analyzed by immunoblotting using anti-LC3, anti-SQSTM1, and anti-GAPDH antibodies. The relative levels of targeted proteins were quantitated by densitometry and normalized to GAPDH control. The data represent means ± SD for 3 independent experiments. *, P < 0.05.

