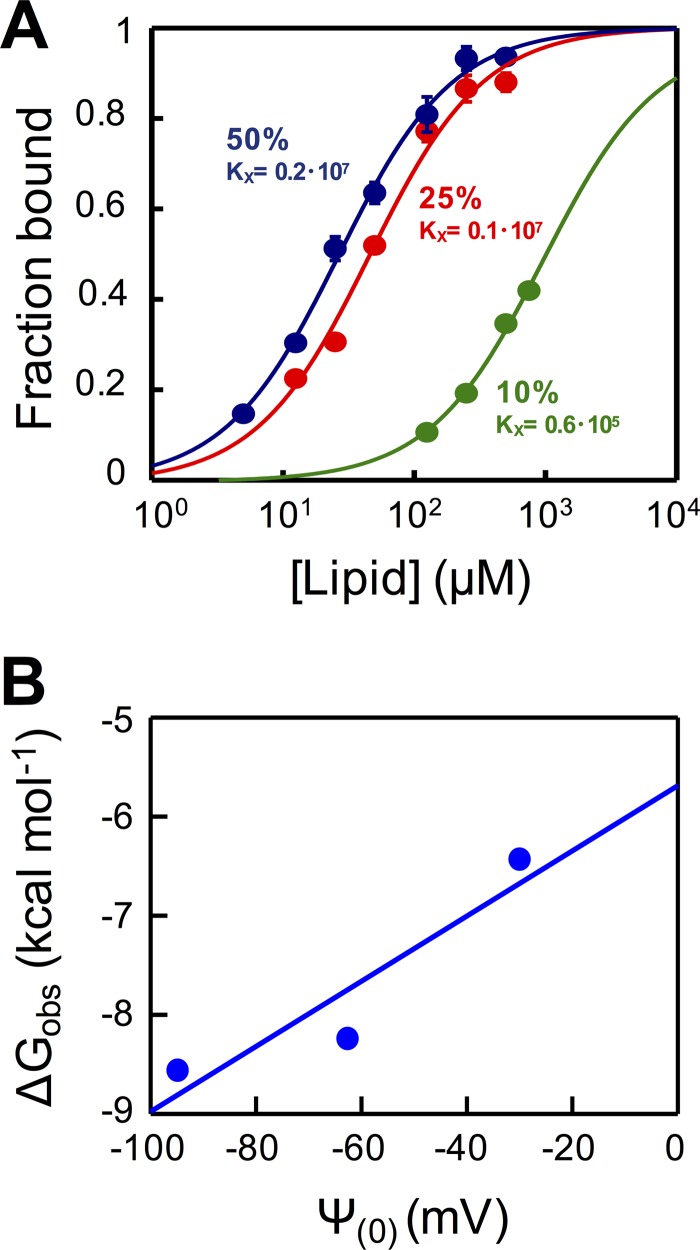
FIG 4.
Binding of 10E8-3R to DOPC:DOPS LUVs monitored by changes in NBD fluorescence. (A) Titration curves obtained by plotting the fraction of NBD-10E8-3R bound as a function of the concentration of lipid accessible on DOPC:DOPS vesicles (half the total lipid concentration) that contained 50, 25, or 10 mol% of DOPS (data depicted in blue, red, and green, respectively). Each symbol on the plot represents an average of data from three independent experiments (± standard deviations if larger than the symbol). The molar fraction partition coefficients, Kx, displayed were calculated from the best fit of equation 1 to the data (curves). (B) Plot of the free energy of partitioning versus the membrane surface potential in the above-described lipid vesicles, estimated according to equations 2 and 3, respectively. The positive slope of the linear regression is consistent with the favorable contribution of electrostatic interactions to membrane partitioning.

