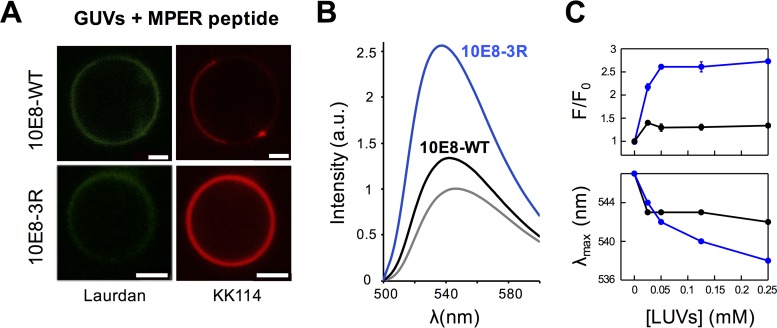
FIG 7.
Effect of enhanced electrostatic interactions on epitope recognition at the membrane surface. (A) Partitioning of KK114-labeled Fabs 10E8-WT and 10E8-3R into VL GUVs decorated with the MPER(671–693) epitope peptide. Conditions are otherwise as described in the legend of Fig. 3. (B) Changes of fluorescence emission spectra upon incubation of NBD-labeled 10E8-WT or 10E8-3R with vesicles that contained 1.7 μM MPER(671–693) (black and blue lines, respectively). The gray line represents the emission spectra of the NBD-labeled Fab fragments in solution. (C) Increase in the fractional emission and change in the position of the maximum fluorescence emission wavelength in the presence of increasing concentrations of vesicles that contained 1.7 μM peptide (top and bottom, respectively). The initial value of fluorescence (F0) was determined from the maximum intensity of the labeled Fab fragment in solution, i.e., before the addition of peptide-containing vesicles. Final fluorescence values (F) correspond to the NBD intensity measured after incubation with vesicles. Black and blue symbols correspond to WT and 3R Fabs, respectively. Each data point corresponds to the average of results from three titrations (± standard deviation), as displayed in panel B.

