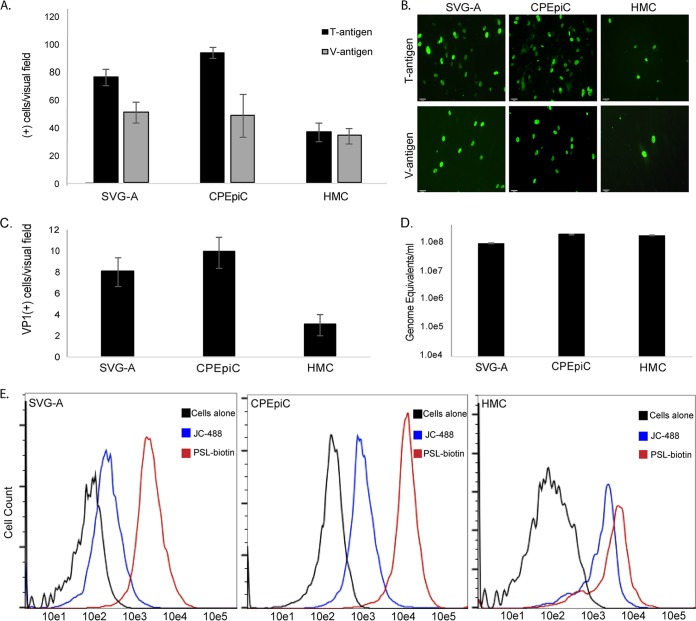
FIG 1.
JCPyV infects CPEpiC and HMC. (A) Quantification of the numbers of T antigen- and V antigen-positive cells per visual field in SVG-A, CPEpiC, and HMC. (B) Representative images of T antigen- and V antigen-positive cells. The infected cells were stained with antibodies to T antigen (Ab-2; Oncogene) and V antigen (Pab597), and then these were detected with goat anti-mouse Alexa Fluor 488-labeled secondary antibodies. (C) Reinfection assay demonstrating each cell line produces infectious virus. (D) ddPCR quantification of the amount of complete virus released by each cell line following one round of infection. (E) Flow cytometric analysis of the binding of Alexa Fluor 488-labeled JCPyV (JC-488) and the LSTc binding lectin PSL to SVG-A, CPEpiC, and HMC as indicated. Error bars represent standard errors of the mean for three independent experiments performed in triplicate.

