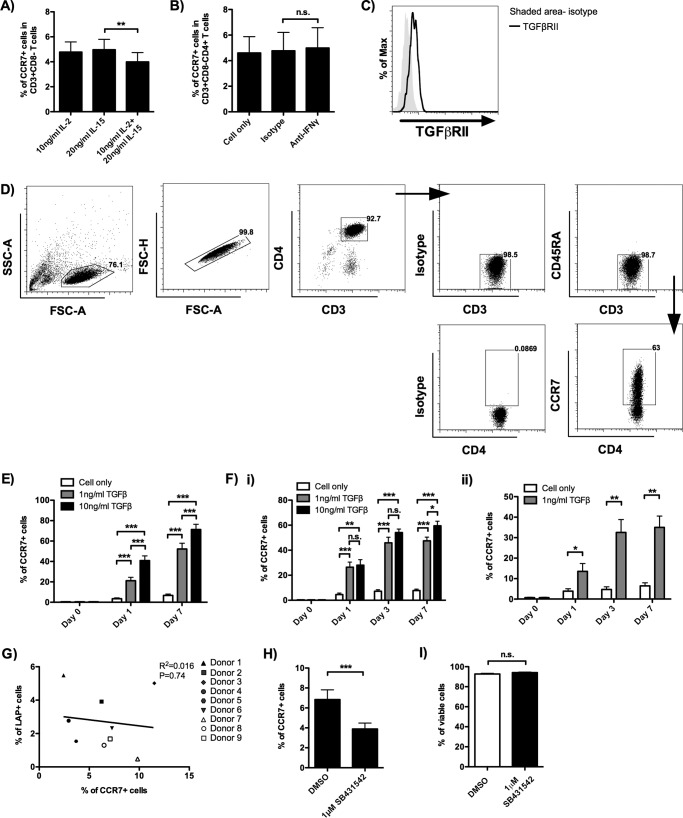
FIG 4.
TGF-β induces the differentiation of α4β7+ TCM from α4β7+ TEM. (A) α4β7+ TEM were isolated and cultured in the presence of the indicated cytokines for 7 days. The results show the percentage of CD3+ CD8− α4β7+ TCM on day 7 (donors = 5). (B) α4β7+ TEM were isolated and cultured in the presence of anti-IFN-γ (20 μg/ml) blocking antibody. The results show the percentage of CD3+ CD8− α4β7+ TCM on day 7 (donors = 4). The corresponding isotype antibody was used as a control. (C) A representative histogram shows the expression of TGF-βRII on CD3+ CD8− CD4+ α4β7+ TEM on the day of α4β7+ TEM isolation (donors = 8). (D) Gating strategy used to identify the CD3+ CD4+ CD45RA− α4β7+ TCM and CD3+ CD4+ CD45RA− CCR7+ TCM in the assays whose results are shown in panels E and Fi and ii. A representative flow cytometric analysis shows the expression of CCR7 on α4β7+ TEM stimulated with 1 ng/ml TGF-β for 7 days. The positive cells were defined using the corresponding isotype controls. (E) α4β7+ TEM were isolated and cultured in the presence of 1 ng/ml or 10 ng/ml TGF-β. The effect of TGF-β on the induction of CD3+ CD4+ CD45RA− α4β7+ TCM from α4β7+ TEM was determined on day 0 (before TGF-β stimulation), day 1, and day 7 during TGF-β coculture (donors = 8). (F) CCR7− CD4 T cells directly isolated from peripheral blood were treated with TGF-β either in the presence (donors = 6) (i) or in the absence (donors = 6) (ii) of IL-2 (10 ng/ml) and IL-15 (20 ng/ml). The effect of TGF-β on the induction of CD3+ CD4+ CD45RA− CCR7+ TCM was determined on days 0 (before TGF-β stimulation), 1, 3, and 7. (G) Correlation between the percentage of LAP+ CD3+ α4β7+ TEM immediately after α4β7+ TEM isolation and the percentage of CD3+ CD8− CD4+ α4β7+ TCM after an additional 7 days of culture (donors = 9). (H) α4β7+ TEM were isolated and cultured in the presence of the TGF-βRI inhibitor SB431542 for 7 days. The results show the percentage of CD3+ CD8− CD4+ α4β7+ TCM on day 7 (donors = 9). Dimethyl sulfoxide (DMSO) at the same concentration as the relative inhibitor concentration was used as the control. (I) Percentage of viable cells in the presence of 1 μM SB431542 (donors = 7), determined by a trypan blue exclusion assay. DMSO at the same concentration as the relative inhibitor concentration was used as the control. Cell counting was performed by use of a Countess automated cell counter. Data are expressed as the mean ± SEM. *, P < 0.05; **, P < 0.01; ***, P < 0.001; n.s., not significant.

