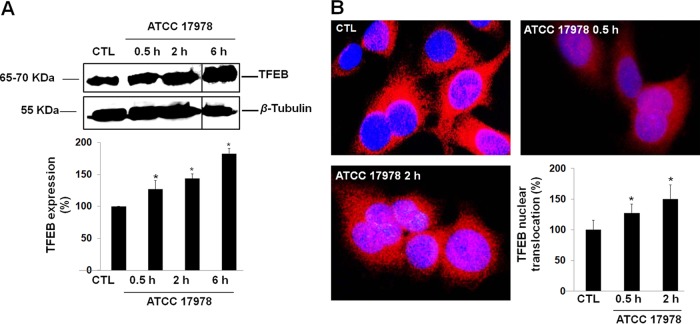
FIG 1 .
Expression of TFEB in A549 cells by A. baumannii. (A) Western blot analysis of TFEB in A549 cells after incubation with A. baumannii ATCC 17978 for 0.5, 2, and 6 h. The solid black lines in the blots separate the spliced portions of the blots between 2 and 6 h. Values shown in the bar graph are the percentage of TFEB expression in control (CTL) and infected A549 cells. (B) TFEB in A549 cells after incubation with A. baumannii ATCC 17978 for 0.5 and 2 h, immunostaining, and imaging by immunofluorescence microscopy. TFEB detected with rabbit anti-TFEB antibodies and labeled with Alexa Fluor 594-tagged secondary antibodies (red). Blue staining with DAPI shows the location of nuclei of A549 cells. The percentage of TFEB expression in the nuclei of A549 cells was calculated as follows: (number of A549 cells that expressed TFEB in the nuclei of A549 cells/total number of A549 cells) × 100. Results are from three independent experiments, and data are means plus standard errors of the means (SEM) (error bars). Values that are significantly different (P < 0.05) between untreated (control [CTL]) and treated groups are indicated by an asterisk.

