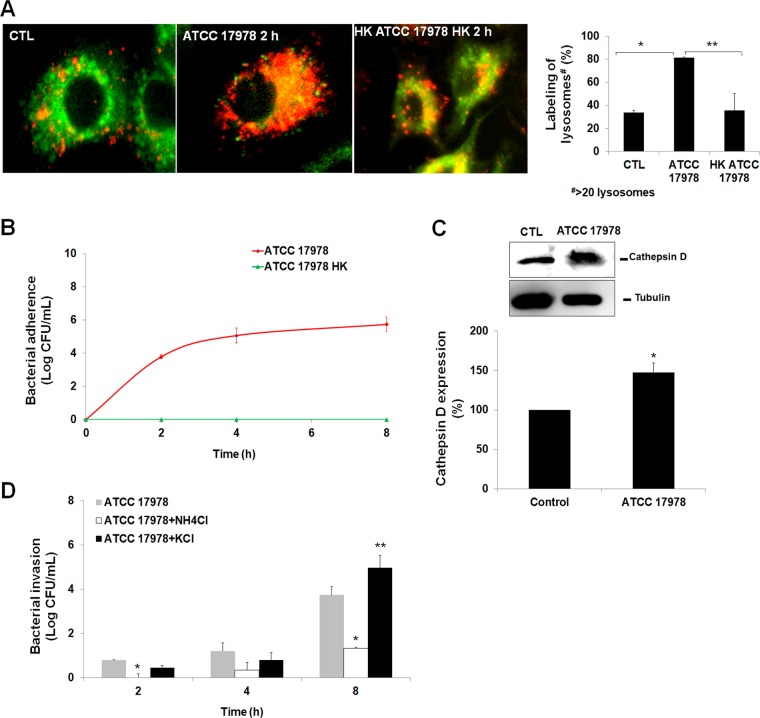
FIG 3 .
Evaluation of the role of the autophagosome-lysosome system in A. baumannii intracellular trafficking. (A) The lysosomes in A549 cells were incubated with A. baumannii ATCC 17978 for 2 h, immunostained, and imaged by immunofluorescence microscopy. Acidic organelles were detected with LysoTracker red (75 nM), and mitochondria were detected with MitoTracker green (250 nM). The values for labeling of lysosomes in infected A549 cells in the bar graph are percentages compared to the value for noninfected cells. Values that are significantly different (P < 0.05) are indicated by bars and asterisks as follows: *, ATCC 17978 and control (CTL) cells; **, ATCC 17978 and heat-killed (HK) ATCC 17978 cells. (B) A. baumannii ATCC 17978 and ATCC 17978 HK invasion into A549 cells for up to 8 h of infection. (C) Western blot analysis of cathepsin D in A549 cells infected with A. baumannii ATCC 17978 for 2 h. Blots were part of the same internally controlled experiment in Fig. 5B. Values are expressed as the percentage of cathepsin D expression level in control and infected A549 cells. Values that are significantly different (P < 0.05) are indicated by an asterisk. (D) A. baumannii ATCC 17978 invasion into A549 cells pretreated for 30 min with NH4Cl or KCl for various lengths of time up to 8 h of infection. Values that are significantly different (P < 0.05) are indicated by asterisks as follows: *, ATCC 17978 cells and ATCC 17978 cells treated with NH4Cl; **, ATCC 17978 and ATCC 17978 treated with KCl.

