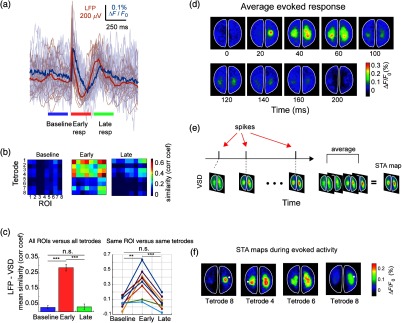
Fig. 4.
Relationship between LFP, single-unit activity, and voltage-sensitive dye signals during evoked responses. (a) Example of mean LFP (orange) from one tetrode and single trials (shaded) and mean VSD (blue) from same ROI and single trials (shaded). Evoked responses are divided into three periods: baseline (last 250 ms before stimulus onset), early evoked response (first 250 ms after stimulus onset), and late evoked response (250 ms after the evoked1 period). (b) Similarity matrices (correlation coefficient) between LFP and VSD for all tetrodes and ROIs for the three periods. (c) (Left) Mean similarity across 20 trials between LFP and VSD for the three periods for all tetrodes and all ROIs (error bars represent SEM). (c) (Right) Mean similarity across trials between LFP and VSD for the same ROIs and tetrode for the three periods. (d) Spatiotemporal pattern of the mean evoked response (20 trials) to hind paw electrical stimulation. (e) STA maps are generated as the average of the VSD frames corresponding to the times when the corresponding neuron fired. (f) Example of STA VSD maps from different neurons across the cortex. The STA maps closely resemble the evoked response in (d). The white dots represent the approximate location where the corresponding neurons were recorded.

