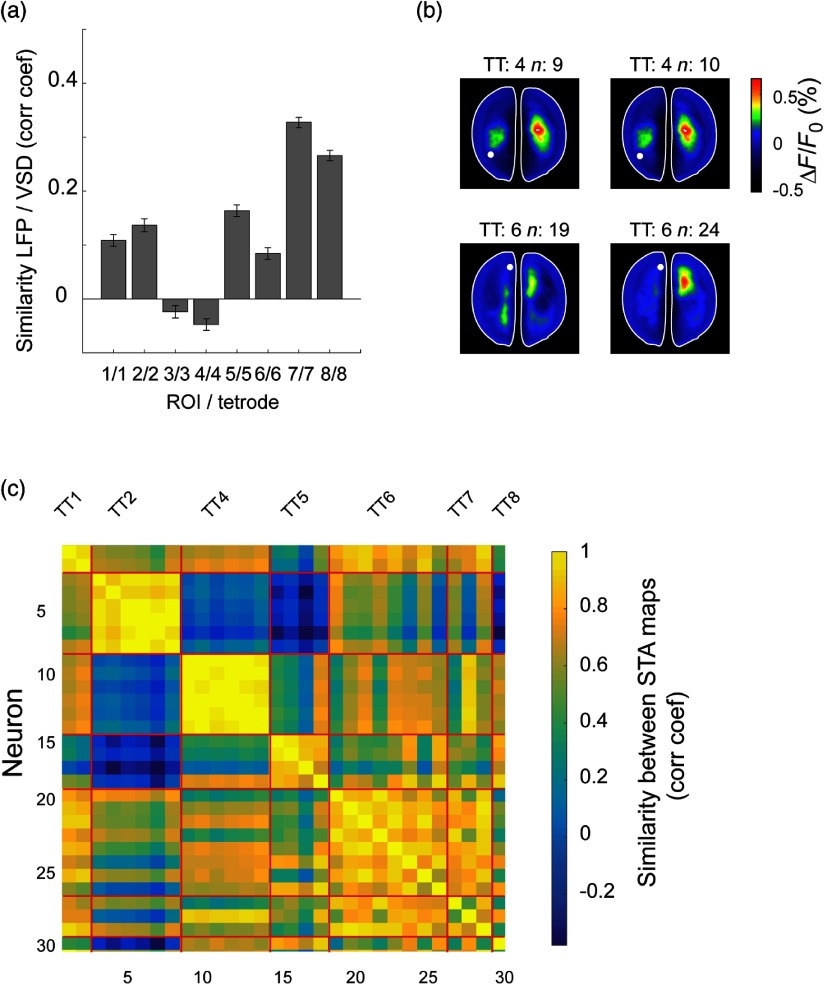
Fig. 6.
Comparison between optical and electrophysiological signals. (a) Similarity between LFP and VSD signals for all the recording locations during 15 min of spontaneous activity (for 1 s segments). (b) STA maps of two neurons recorded in the same tetrode (TT), which are very similar (top row) and STA maps of two neurons recorded in the same tetrode, which are different (bottom row). (c) Similarity matrix (correlation coefficient) for the STA maps generated for all neurons.

