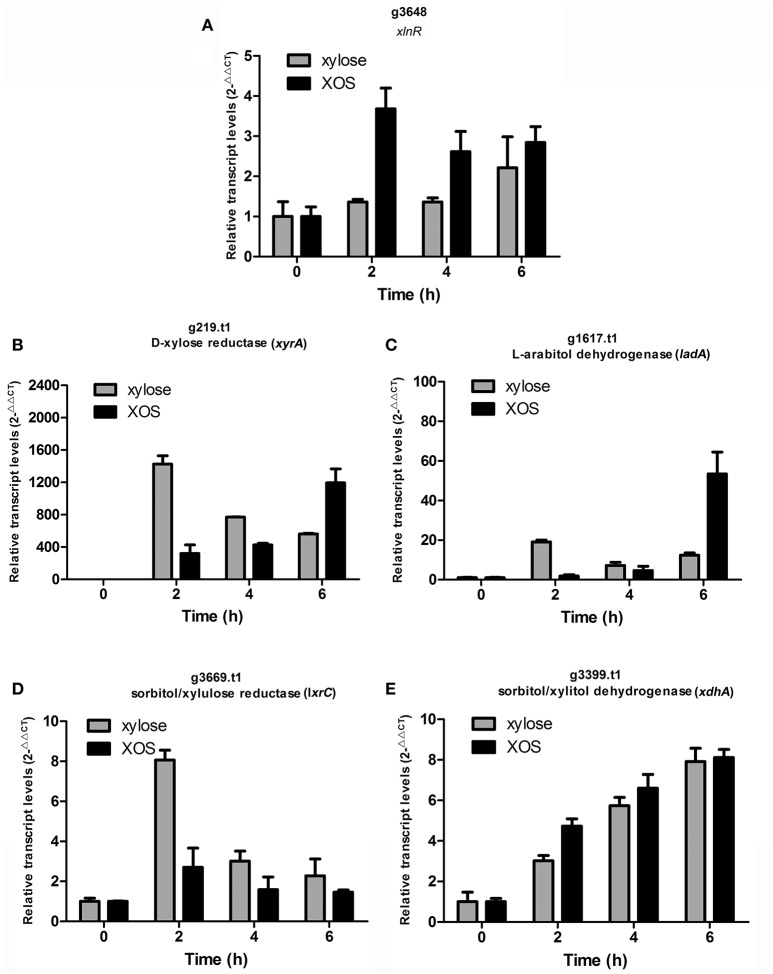
Figure 5.
Time-course analysis of transcript levels of genes encoding (A) transcription activator (xlnR; g3648.t1), (B) D-xylose reductase (xyrA; g219.t1), (C) L-arabitol dehydrogenase (ladA; g1617.t1), (D) xylulose reductase (lxrC; g3669.t1), and (E) xylitol dehydrogenase (xdhA; g3399.t1) by qPCR in Aspergillus niger An76 induced using 1% xylose or 1% XOS. Glyceraldehyde-3-phosphate dehydrogenase (gapdh; g7576.t1) was used as reference gene. The results were calculated as the relative transcription level using the 2−ΔΔCt method. Values represent the mean from two independent biological experiments measured in triplicate, and error bars indicate the standard deviations.

