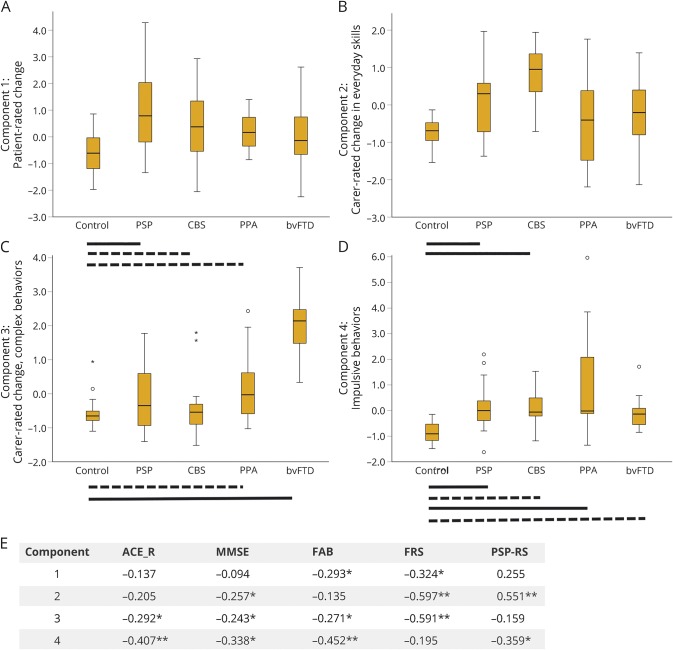
Figure 1. Component scores by diagnostic group.
(A–D) Boxplots of principal component scores (2–4) by diagnosis for the imaged subset (n = 97). Bars indicate significant differences between each group and controls using analysis of variance with post hoc least significant difference tests (solid lines p < 0.001, dashed lines p < 0.05), and circles/stars represent outliers (1.5*IQR/3*IQR, respectively). (A) Component 1 representing patient-rated behavioral change as measured by the AES, Barratt Impulsiveness Scale, Snaith-Hamilton Pleasure Scale, Beck Depression Inventory–II, and Motivation and Energy Inventory. (B) Component 2 reflecting carer-rated change in everyday skills, self-care, and motivation as measured by the CBI subscores, AES, and NPI apathy subscore. (C) Component 3 reflecting carer-rated change in complex behaviors as measured by the CBI abnormal/stereotypic behaviors, eating habits, mood and motivation subscores, AES, and NPI disinhibition subscore. (D) Component 4 indicating poor performance on behavioral tasks of response inhibition (Go/NoGo motor and saccade), reflection impulsivity (information sampling task), and reward responsiveness (cured reinforcement reaction time task). Significant differences were also observed between groups for component 1 (F4,92 = 7.462, p < 0.001, post hoc control vs PSP p < 0.001, vs CBS p < 0.05, vs PPA p < 0.05, PSP vs PPA p < 0.05, vs bvFTD p < 0.05), component 2 (F4,92 = 9.132, p < 0.001, post hoc control vs PSP p < 0.001, vs CBS p < 0.001, PSP vs CBS p < 0.05, vs PPA, p < 0.05, CBS vs PPA p < 0.001, vs bvFTD p = 0.001), component 3 (F4,92 = 23.832, p < 0.001, post hoc control vs bvFTD p < 0.001, vs PPA p < 0.05, PSP vs bvFTD p < 0.001, CBS vs bvFTD p < 0.001, PPA vs bvFTD p < 0.001), component 4 (F4,92 = 10.902, p < 0.001, post hoc control vs PSP p = 0.001, CBS p < 0.05, PPA p < 0.001, bvFTD p < 0.05, PSP vs PPA p < 0.05, CBS vs PPA p < 0.05, PPA vs bvFTD p = 0.001). (E) Components 1–4 correlated with measures of cognition (ACE-R, MMSE, FAB) and disease severity (FRS, PSP-RS) with higher component scores reflecting greater cognitive impairment, functional decline, and disease severity (note Pearson correlation, p < 0.001 uncorrected here approximates p < 0.05 corrected for multiple comparisons). * = p < 0.05; ** = p < 0.001 unc; ACE-R = Addenbrooke's Cognitive Examination–Revised; AES = Apathy Evaluation Scale; bvFTD = behavioral variant frontotemporal dementia; CBI = Cambridge Behavioral Inventory; CBS = corticobasal syndrome; FAB = frontal assessment battery; FRS = Frontotemporal Dementia Rating Scale; IQR = interquartile range; MMSE = Mini-Mental State Examination; NPI = Neuropsychiatric Inventory; PPA = primary progressive aphasia (all groups); PSP = progressive supranuclear palsy; PSP-RS = PSP Rating Scale.

