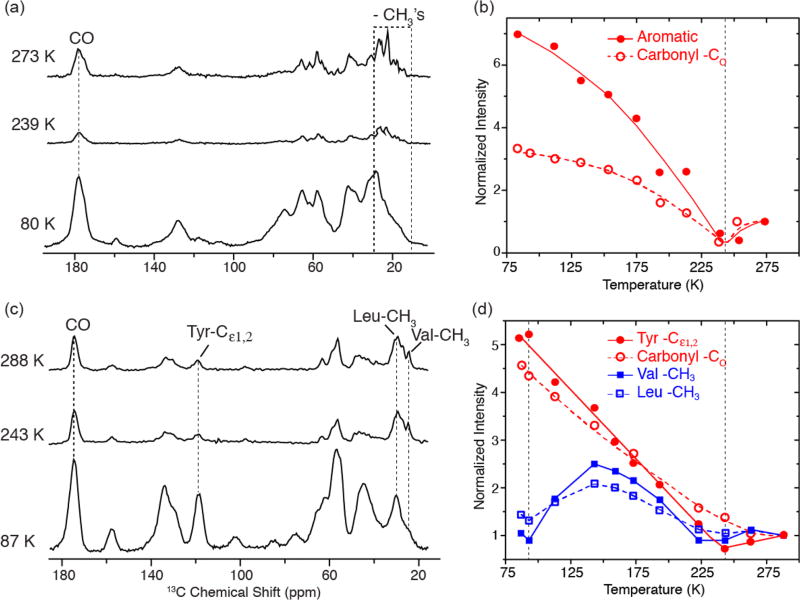
Figure 4.
Temperature-dependent 1H−13C CP spectra of (a) [U−13C, 15N] bacteriorhodopsin and (c) [13C, 15N-FVYL]-PI3-SH3 amyloid fibrils without Boltzmann correction. In parts b and d, we show plots of normalized intensities for carbonyl, aromatic, and aliphatic regions in bR and PI3-SH3 fibrils as a function of temperature. Both the carbonyl and aromatic regions experience a minimum in intensity around 243 K followed by a steady increase as the temperature is decreased for both systems. The intensity of −CH3’s in the valines and leucines in PI3-SH3 also reveals a minimum at ~243 K, followed by a second minimum at ~95 K, where the intensity losses are again due to −CH3 hopping interfering with 1H decoupling and spin-lock fields. Both samples were cryoprotected in d8-glycerol/D2O/H2O (60/30/10 volume ratio). Full sets of spectra at different temperatures are provided in Figures S3 and S4. The spectra were acquired with ωr/2π = 4.83 kHz for bR and 7 kHz for PI3-SH3. In both cases, ω1H/2π = 83 kHz for TPPM decoupling.

