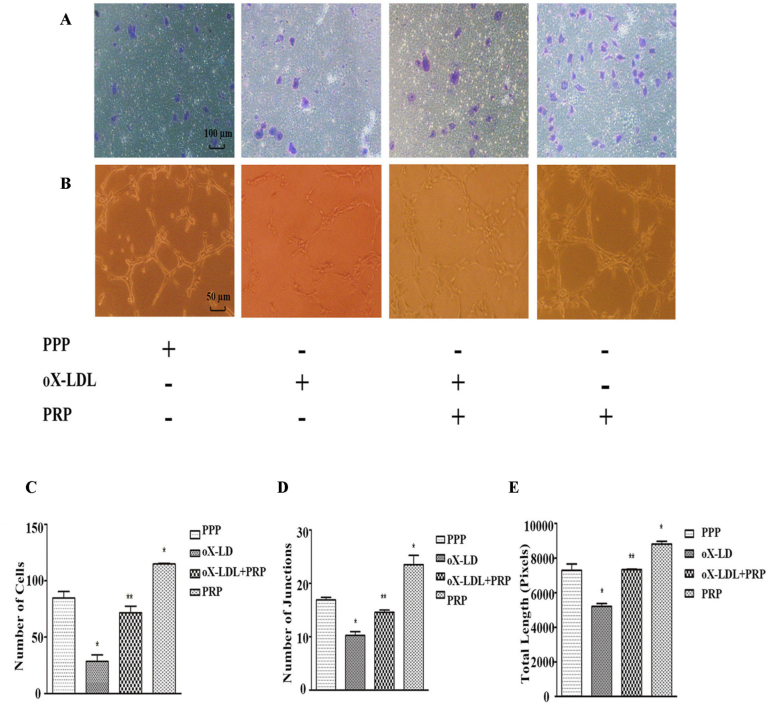
Figure 2.
Capacity of migration and tube formation (mean ± SD). A: Cells that had migrated through the membrane were stained with crystal violet. B: Junctions and length of loops formed by HUVECs were calculated and analyzed. C: Number of migrated cells. D: Number of joints. E: Total length. *p<0.05 versus control; **p<0.05 versus oX-LDL.

