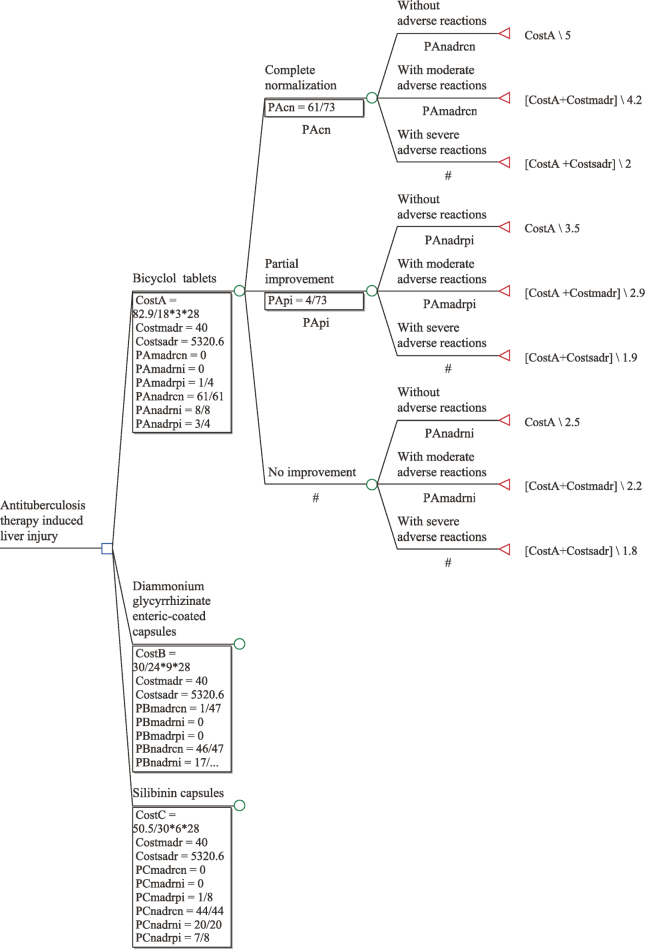
Figure 1.
Decision tree model structure
The decision node is represented with “□” and it is the starting point of the decision problem. The state point is represented with “O,” indicating the status that the scheme has met with. The lines drawn from the state point indicate a variety of possible states that may occur; next to them, all status contents are marked, and the degree of possibility for development is expressed by probability. The terminal point of decision is expressed by “Δ,” next to which the assigned value of each effect degree is marked.

