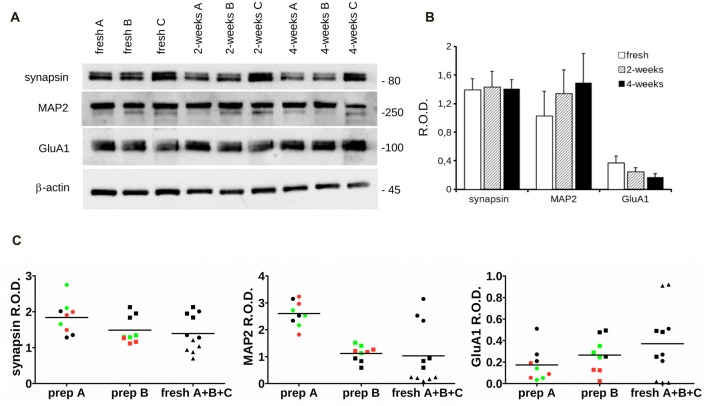
Figure 5.
Biochemical analysis of cryopreserved cultures. (A) We analyzed the expression level of specific synaptic markers in acutely dissociated cortical neurons vs. cultures cryopreserved for 2 or 4 weeks. Cultures were processed for western-blotting at DIV14 to measure synapsin, MAP2, GluA1 and β-actin levels. (B) The graph reports synapsin, MAP2 and Glu1A levels, expressed as relative optical density (ROD) normalized vs. β-actin. Data are expressed as mean ± SEM, n = 6. (C) The scatter plots show the distribution of single data points obtained from acutely dissociated (black), 2-weeks (green) and 4-weeks (red) cryopreserved cultures coming from two distinct neuronal preparations (prep A and prep B) or combining data from three fresh cultures A (circle), B (square) and C (triangle; fresh A + B + C).

