Figure 2.
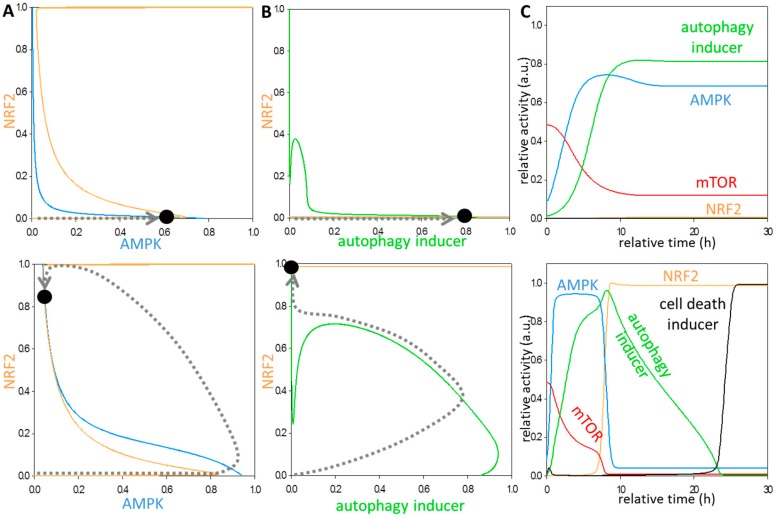
The characteristic properties of control network at various levels of oxidative stressor. (A) AMPK-NRF2 and (B) autophagy inducer-NRF2 phase plane diagrams at low (upper panel) and high (lower panel) levels of oxidative stress. The balance curves of AMPK (light blue), autophagy inducer (green) and NRF2 (yellow) are plotted. The phase planes are shown for (upper panel) stress = 0.1 and (lower panel) stress = 5. Intersections of nullclines represent the stable (filled circle) steady states. Trajectories are depicted with dotted grey lines. (C) The computational simulations are determined at low (upper panel) and high (lower panel) levels of oxidative stress. The dynamic simulation of the model with (upper panel) continuous low stress conditions (stress = 0.1) and (lower panel) continuous high stress conditions (stress = 5). The relative activity of mTOR, AMPK, NRF2 and autophagy inducer is shown.

