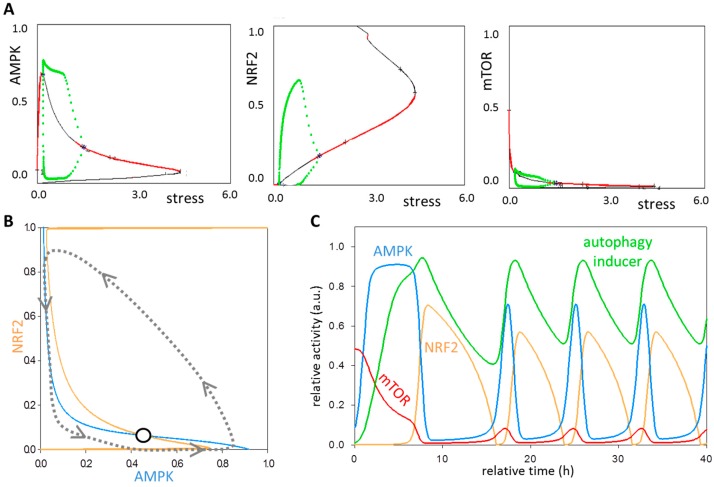
Figure 4.
The oscillatory characteristic of the oxidative stress response mechanism. (A) The bifurcation diagrams of AMPK (panel left), mTOR (panel middle) and NRF2 (panel right). The signal response curves are shown with respect to the increasing stress level. Solid red lines denote stable states, while solid black line denotes the unstable state. Green dots around the unstable states represent oscillatory behavior. (B) Phase plane diagram at intermediate levels of oxidative stress. The balance curves of AMPK (light blue) and NRF2 (yellow) are plotted. The phase plane is shown for stress = 0.5. Intersection of nullclines represent the unstable (open circle) steady state. The trajectory is depicted with dotted grey line. (C) The computational simulations are determined at intermediate levels of oxidative stress (stress = 0.5). The relative activity of mTOR, AMPK, NRF2 and autophagy inducer are shown.

