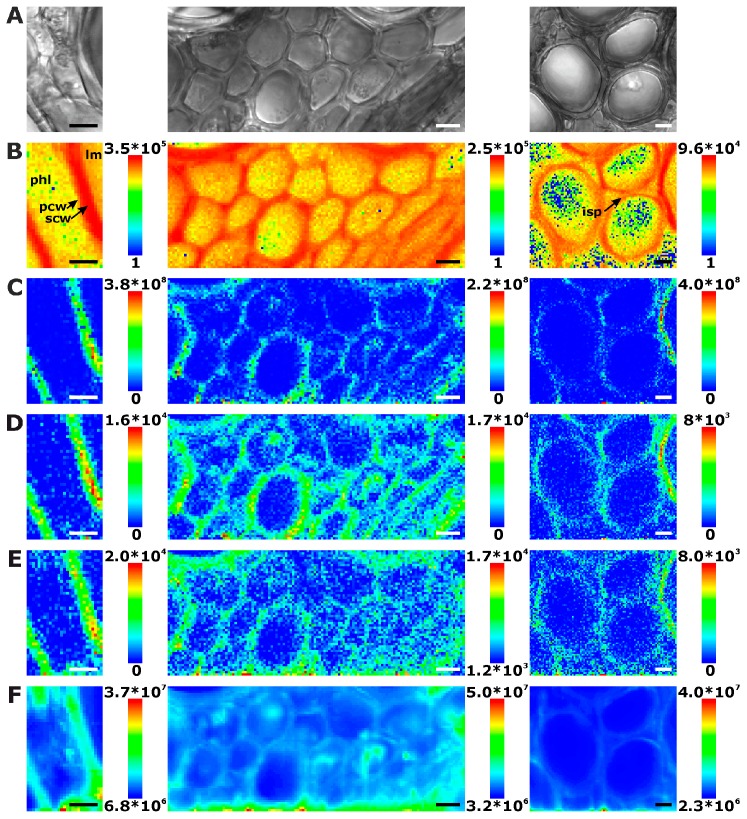
Figure 3.
Chemical images of three exemplary mapping data sets of cross sections of cucumber stem xylem. (A) Bright field images; (B) Integral intensity in the region 1550–1700 cm−1, obtained after baseline correction; (C) Product of the intensities of the cellulose bands at 1092 cm−1 and 1337 cm−1, respectively, cf. (D,E); (D) Intensity at 1092 cm−1 (baseline corrected in the range 1070–1108 cm−1); (E) Intensity at 1337 cm−1 (baseline corrected in the range 1313–1358 cm−1); (F) Intensity integrated over the full spectral range 600–2000 cm−1. Abbreviations: lm: lumen; phl: phloem; scw: secondary cell wall; pcw: primary cell wall; isp: intercellular space. Scale bars: 10 µm, mapping step size: 1 µm, excitation wavelength: 532 nm, excitation intensity: 1.7 × 10⁶ W/cm2, accumulation time: 1 s.

