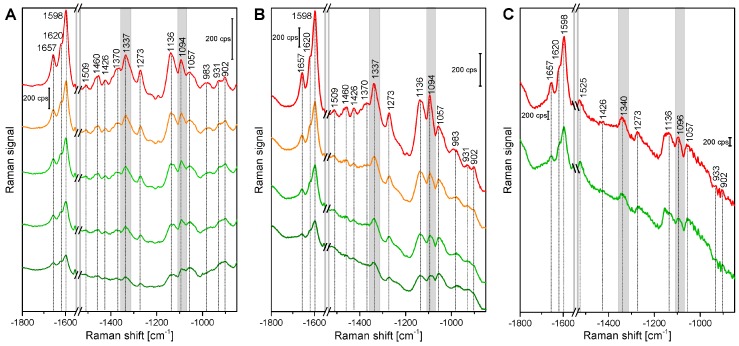
Figure 6.
(A–C) Average spectra of the HCA clusters shown in Figure 5A–C with the same color codes of Raman maps of cross sections of (A) root; (B) stem; and (C) leaf tissue. HCA is based on spectra of three merged spectral regions of vector normalized first derivatives: 1070–1108 cm−1, 1313–1358 cm−1, and 1550–1800 cm−1.

