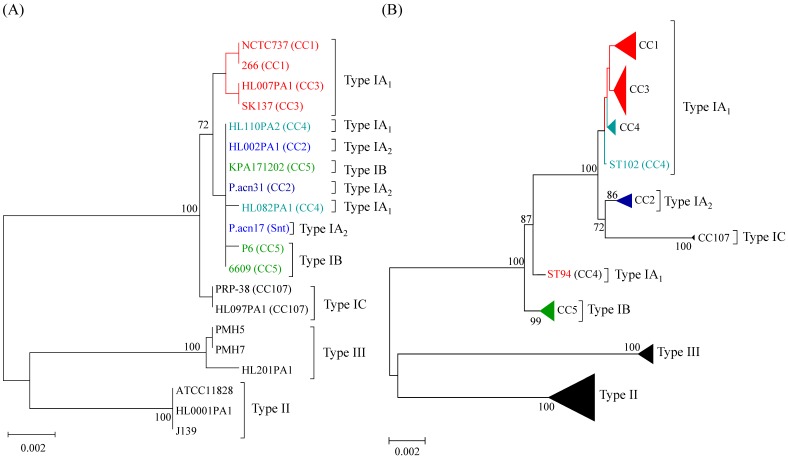
Figure 2.
Minimum evolution phylogenetic trees of concatenated recA and tly sequences (1824 bp) from isolates selected to represent all known phylogroups (A), and concatenated gene sequences (4235 bp) from all current STs in the MLST8 database (B); the latter is updated from [43] with STs. Bootstrapping statistics were performed using 500 data sets, and only bootstrap values ≥70% are shown. Clonal complexes (CC) are indicated. An overlapping cluster of strains from CC4 (type IA1), CC2 (type IA2) and CC5 (type IB) can clearly be seen based on analysis of recA and tly sequences (A), but on MLST8 analysis strains from these different phylogroups form separate, distinct clusters with high bootstrap values (B).

