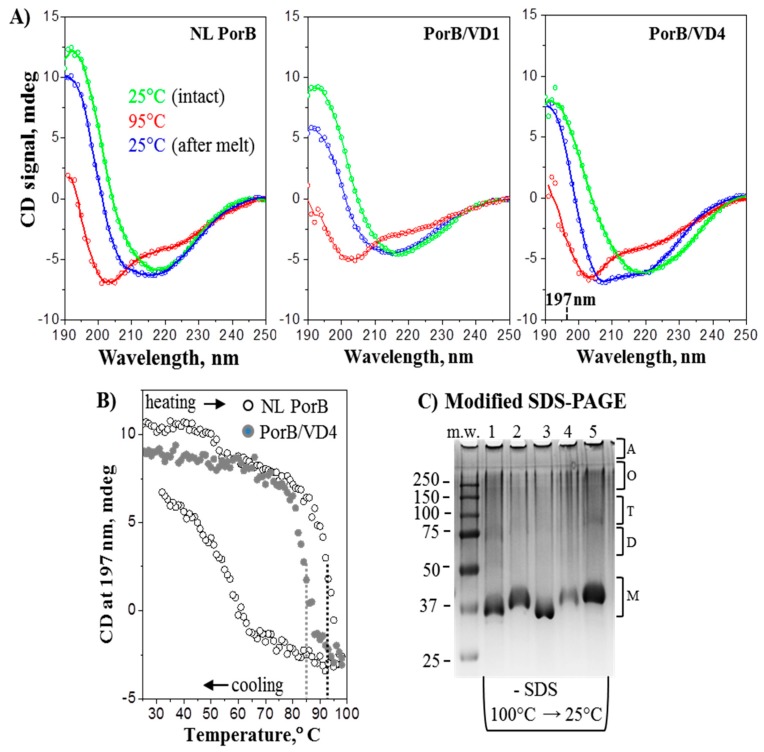
Figure 4.
Secondary structure and thermal stability of PorB/VDs. (A) Far-UV CD spectra of NL PorB, PorB/VD1 and PorB/VD4 (left to right) representative of the PorB/VDs. In each panel, three consecutive spectra were recorded of the same sample (0.18 mg/mL protein in 10 mM sodium phosphate and 0.05% Zwittergent 3–14 at pH 8.0). Green lines: intact sample at 25 °C. Blue lines: sample was heated to 98 °C and cooled to 25 °C, followed by data collection at 25 °C. Red lines: sample was incubated at 95 °C for 5 min and the data was recorded at 95 °C. (B) Representative thermal denaturation data recorded at 197 nm during sample heating from 25 °C to 98 °C, followed by cooling to 25 °C at a rate of 70 °C/h. Sample conditions are as in panel A. The directions of the temperature changes are indicated. Vertical dotted lines indicate the midpoints of thermal unfolding. (C) Coomassie staining of modified SDS-PAGE. Samples were dissolved in SDS-free loading buffer, heated at 100 °C for 5 min. and cooled to 25 °C prior to electrophoresis. Lane 1: NL PorB; Lane 2: PorB/VD1 Lane 3: PorB/VD2; Lane 4: PorB/VD3; Lane 5: PorB/VD4. The predicted position of bands of molecular weight corresponding to monomers (M), dimers (D), trimers (T), oligomeric forms (O) and aggregates (A) are indicated.

