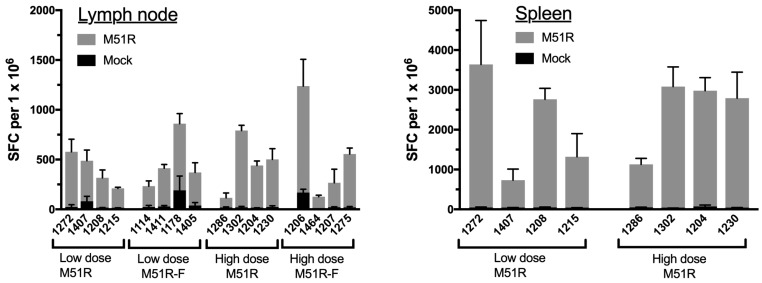
Figure 2.
Cellular immune response in lymph node and spleen. Cells from the 6 week right axillary lymph nodes were re-stimulated with autologous APC infected with M51R VSV, and IFNγ production was measured by ELISPOT (gray bars). The number of spot-forming cells (SFC) per 106 lymph node responder cells is shown for each animal (mean ± SD, triplicate values). Data from responder cells restimulated with mock-infected APC are shown by the black bars. The same experiment was done with spleen cells (right panel) from low and high dose M51R-vaccinated animals (cohorts 1 and 2, respectively). For both lymph node and spleen experiments, no significant differences between the 4 cohorts were found by ordinary one-way ANOVA (p > 0.05).

