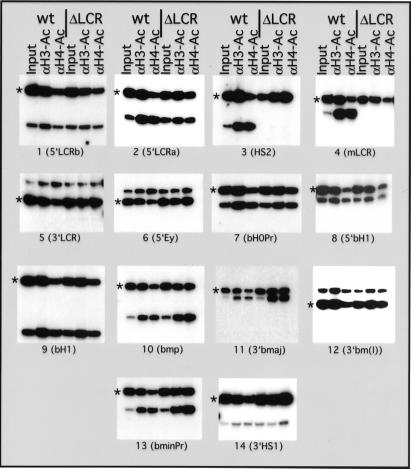
Figure 3.
Analysis of histones H3 and H4 acetylation across the wt and ΔLCR mouse β-globin locus. Chromatin was immunoprecipitated with an Ab that detects all acetylated variants of histone H4 [aH4-Ac] and an Ab that detects acetylated lysines 9 and 14 of histone H3 [aH3-Ac]. Abundance of the mouse globin sequence was detected relative to the mouse amylase gene, which is hypoacetylated in erythroid cells (12). Duplex PCR was performed on the input and Ab-bound fraction from the chromatin IPs by using amylase- and βglobin-specific primers. In each set, the amylase amplification product is marked with an asterisk. The β-globin amplicons are numbered in 5′ to 3′ direction of the locus. Locations of the amplicons in the locus are shown in Fig. 4 and primer sequences are listed in Table 1. Quantification of the ratio of globin to amylase is pictured in Fig. 4 and reveals up to 25-fold enrichment of globin sequences in the bound fraction. The figure shows the amplification products from one of three independent experiments.

