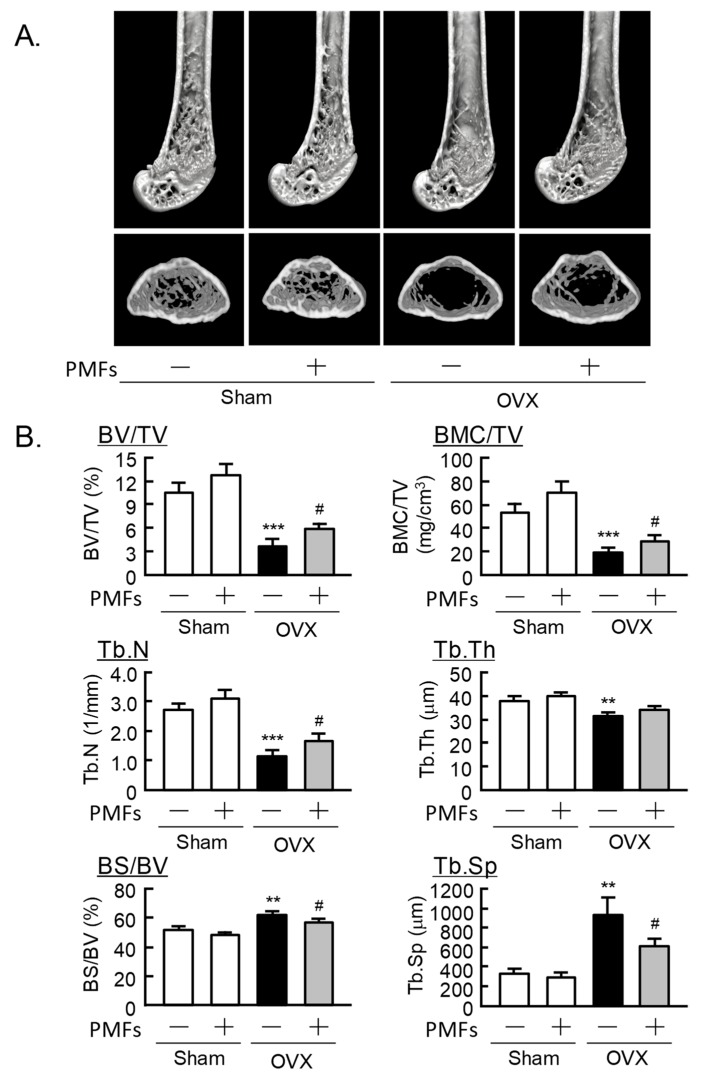
Figure 3.
The μCT analysis of the trabecular bone mass of the distal femur in mice. (A) Three-dimensional (3D) μCT reconstruction images for the distal femur. (B) The parameters (BV/TV, BMC/TV, Tb.N, Tb.Th, BS/BV, and Tb.Sp) of trabecular bone were analyzed using μCT. Data are expressed as the means ± SEM of 6–8 mice. Significant differences between the two groups are indicated; ** p < 0.01 and *** p < 0.001 vs. Sham without PMFs, # p < 0.05 vs. OVX without PMFs.

