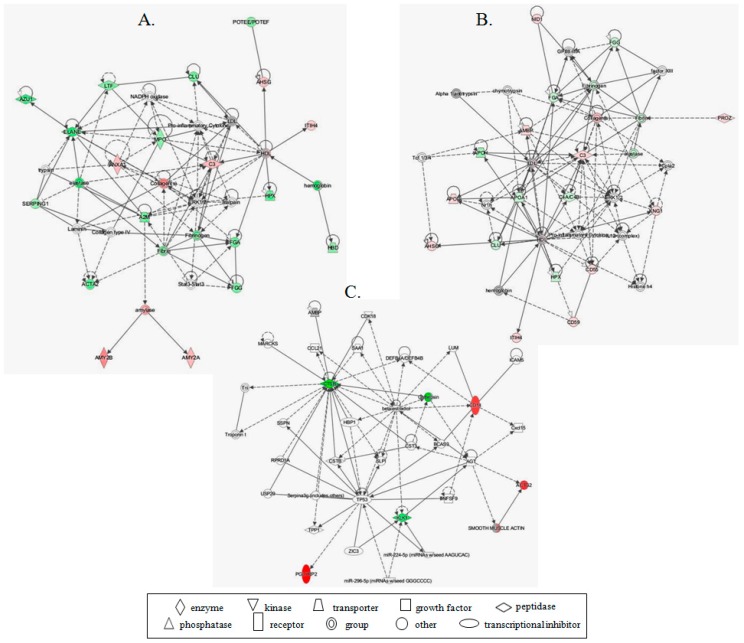
Figure 4.
Networks associated with proteins with differential abundance, according to IPA. (A) Highest ranked protein network of functional associations between 19 proteins with differential abundance in PCa vs. BPH-Cell-To-Cell Signaling and Interaction, Hematological System Development and Function and Immune Cell Trafficking; (B) Highest ranked protein network of functional associations between 17 proteins with differential abundance in PCa vs. BC-Hummoral Immune Response, Inflammatory response, Hematological System Development and Function; (C) Highest ranked protein network of functional associations between five proteins with differential abundance in PCa vs. RC-Cellular Movement, Hematological System Development and Function and Immune Cell Trafficking. The network is graphically displayed with proteins as nodes and the biological relationships between the nodes as lines. The proteins are distributed according to the subcellular localization. The color of the shapes indicates the degree of over-expression (red) or under-expression (green) of the corresponding protein in PCa. Direct connection between molecules is represented by a solid line while indirect connection with broken line. The length of a line reflects published evidence supporting the node-to-node relationship concerned.

