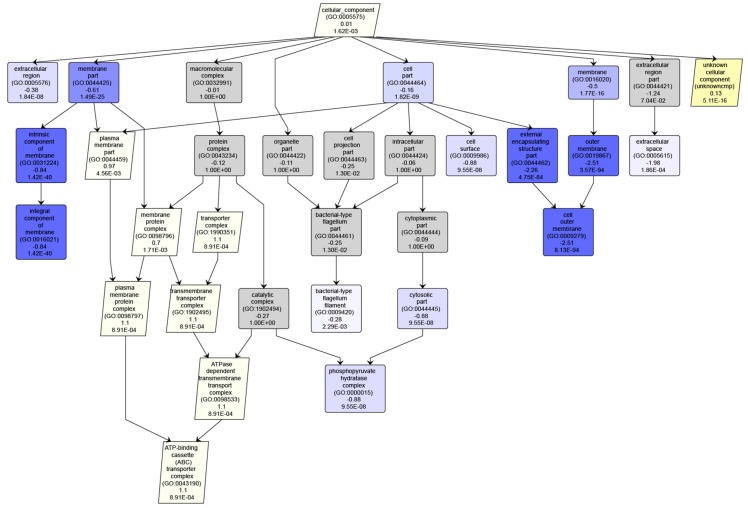
Figure 3.
An example GO graph generated by comparing two experiments using the MetaGOmics server. Each node is a GO term, with lines indicating edges between those nodes in the GO structure. Each node is labeled with the name of the GO term, the log fold change, and the q-value. Nodes with a positive log-fold change are shaped as parallelograms, and shaded yellow—where darker shades of yellow indicate more significant q-values. Nodes with a negative log-fold change are shaped as rectangles, with shades of blue indicating q-value significance. Grey terms are not statistically significant. In this example, GO terms with the “cellular component” aspect were compared. The ratio of spectra in the second experiment matching proteins that localized to the outer cell membrane, extracellular space, phosphopyruvate hydralase complex, and integral component of the membrane were significantly reduced. Whereas, the ratio of spectra matching proteins with an unknown cellular component and ATP-binding (ABC) transporter complex were increased.

